Technical analysis by Nabi_Gunduz about Symbol BTC on 11/17/2025

Nabi_Gunduz
سقوط بیت کوین تا کجا ادامه دارد؟ تحلیل تکنیکال SMA50 و احتمال ریزش شدید BTC
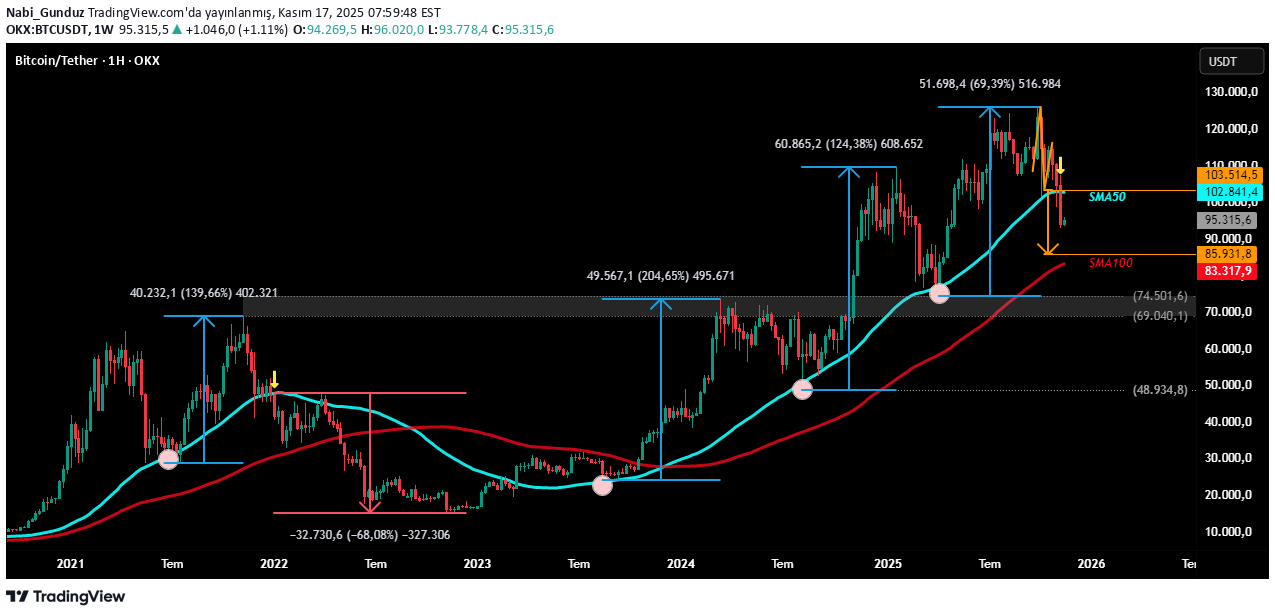
Hello, The 50-week Simple Moving Average, seen in blue on the chart, worked as support 3-4 times in the past, and serious increases were experienced after the reaction from this moving average. Since 2000, this moving average has been broken downwards once, and then there was a decrease to the 100-week Simple Moving Average, then SMA50 was tested again and SMA100 was broken downwards, and in that period, there was a 68% decrease after the downward break of SMA50. Now again, SMA50 has been broken downwards on a weekly basis. There is no rule that the same movement in the past will be repeated, but a downward chart formation that I have highlighted in orange on the chart also supports the possibility of such a decline. The target of the formation is 85931.8 and the SMA100 level is around 83318. In other words, there is a possibility that there may be a decrease to these levels in the first place. A weekly candle closing below SMA100 may cause the decline to deepen. Of course, it should not be forgotten that this possibility of decline may occur rapidly, but it may also occur lingering. In order for the price to overcome the downward pressure, it will be necessary to see a few weekly candle closings above SMA50. The area shown below in gray is a very important area. A downward break in this region could lead to a serious collapse. There is no such thing as impossible in financial markets. That's why you should always be cautious. I wish you success in your trading...