Technical analysis by Nabi_Gunduz about Symbol PAXG on 11/16/2025

تحلیل طلای اونس (16/11/2025): آیا سقوط بزرگ در راه است؟
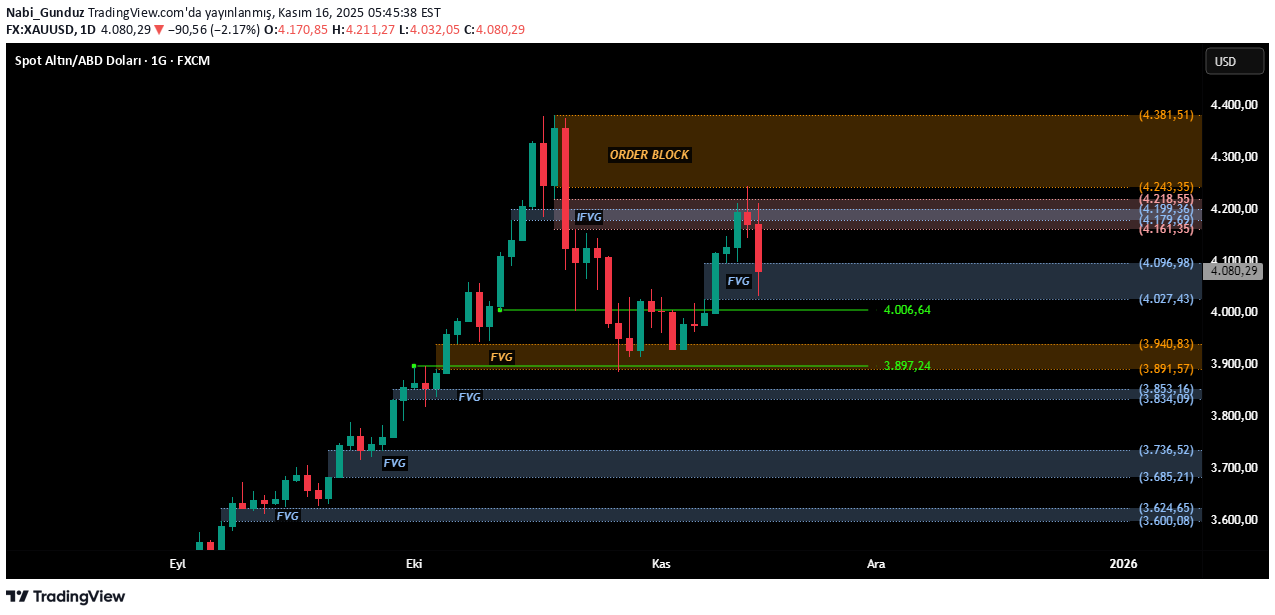
Hello, The details in our main chart are very important. I would like to list these in a few items... 1-) There was no daily candle closing above the upper level of the blue IFVG region, which is within the pink colored region. This IFVG region has an important mission. The last rise before the peak occurred with the downward break of the FVG region and created a decline possibility. In fact, after the region broke downwards, the price dropped by approximately $250. So, there is a possibility that this latest rise could be a re-test for the IFVG zone in question. In other words, the possibility of a new downward wave after the region is tested should be taken into consideration. 2-) The price selling at the alt level in the Order Block (ORDER BLOCK), seen in orange above, indicates that orders in this region may have been activated. 3-)The range I have indicated with 2 green lines on the chart is the last upward FVG in the weekly time period, and a weekly candle closing below this region may cause the price to drop seriously. The last bottom level in the same place has a special importance and I will explain it with the graph below, which will indicate the possibility of a different formation. 4-) It should also be noted that the price may consolidate for a while between the 2 orange zones on the chart. Now let's come to the importance of the last low level... As can be seen in the chart, if a new downward wave occurs according to the 12 and 20 depth wave structure and if this wave forms LL without LH, a 123 pattern formation will be formed, so there will be a possibility that the price will fall to at least the 3708-3640 region with the daily candle closing below the last bottom level. In such a case, the decline may even deepen and fall to 3529 or 3392 levels. (LH=A higher low than the previous low. - LL=A lower low than the previous low.) Let me explain this situation to you from a different perspective, with 2 Harmonic Formation possibilities: If the price continues to decline (LL), a BAT harmonic formation may come into play as seen in this chart; It may also make a failed bottom (LH) and turn into a BUTTERFLY Harmonic Pattern, as seen in this chart... Please consider these 2 graphs as if I were just playing the devil's advocate. So please don't think that it will happen like this. When we examine this chart in the 4-hour period, there is a SELL signal that is stuck at the signal level of the previous bearish formation but was formed according to the last low-depth wave structure. It should be noted that since the wave depth is low, the reliability of this structure will also be low. I would like to end my analysis this weekend by sharing as a footnote a harmonic formation in the 4-hour period, which also indicates the possibility of a decline. NOTE: Harmonic formations are not formations that can be trusted alone. It must be supported by different technical analyses. I wish you all a HAPPY SUNDAY...