Technical analysis by AstronautPioneer about Symbol PAXG on 11/14/2025

AstronautPioneer
تحلیل تکنیکال طلا: سطوح کلیدی خرید و فروش امروز (۱۴ نوامبر)
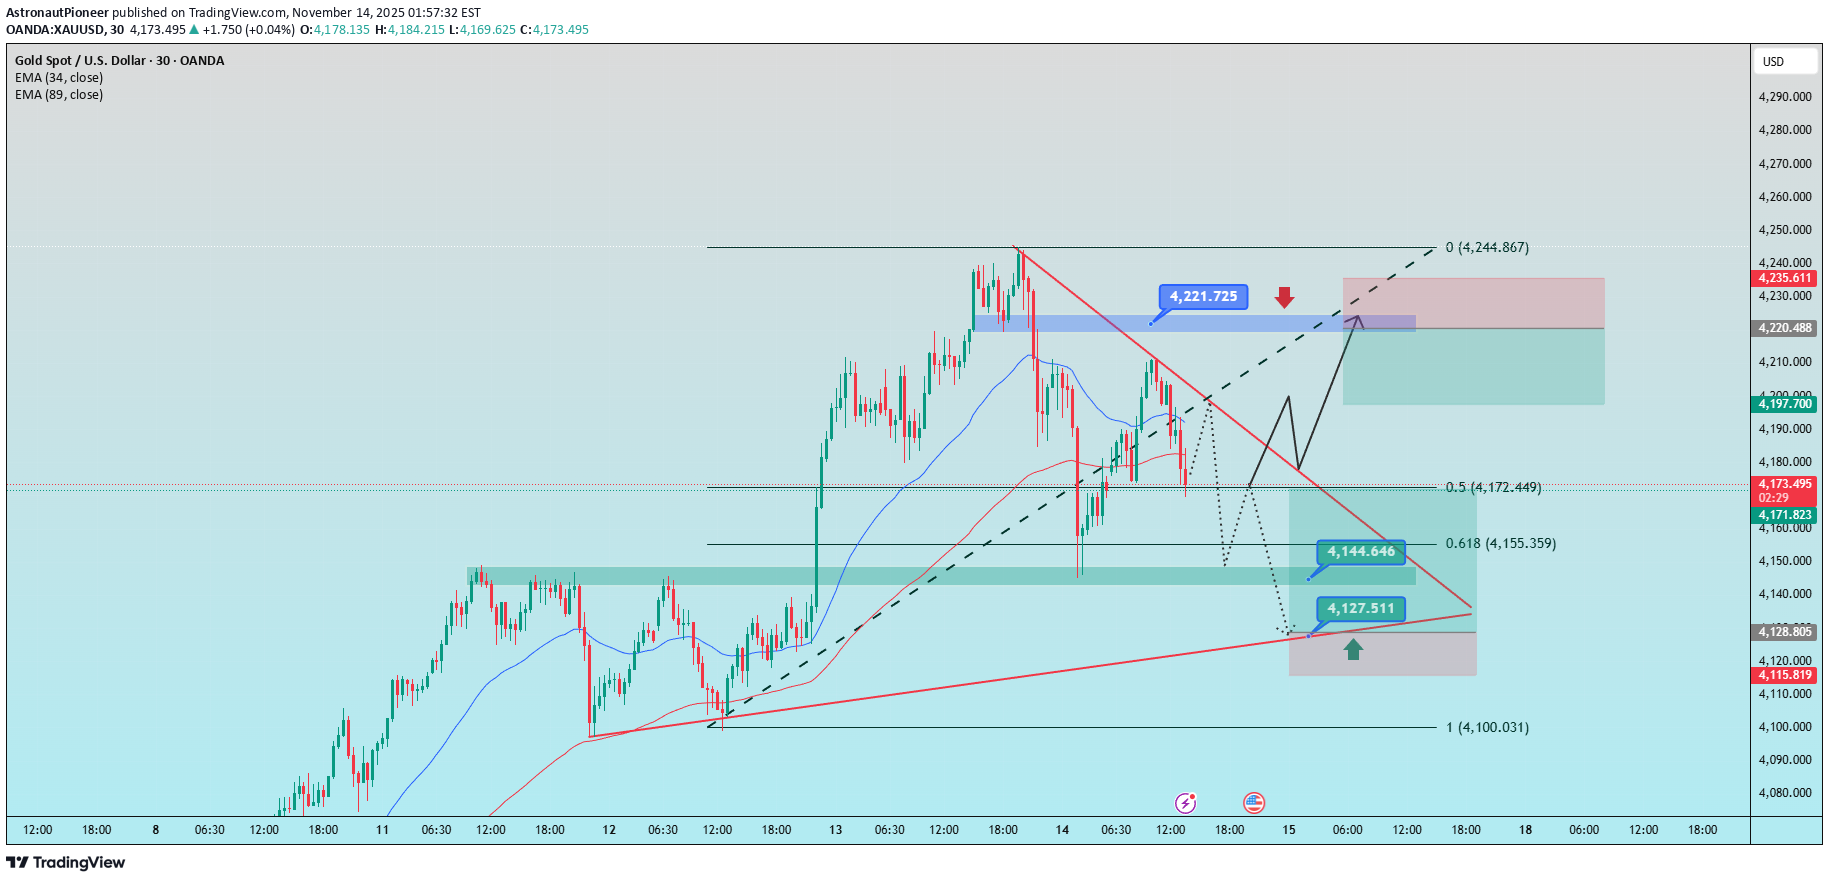
1. Trendline Descending trendline (upper red): Price is repeatedly rejected here → a strong dynamic resistance. Ascending trendline (lower red): Price has bounced multiple times → an important dynamic support, forming a confluence with the 0.618 Fibonacci level. 2. Resistance 4,215 – 4,225: Supply zone + confluence with the descending trendline → a high-probability selling area. If price breaks strongly above 4,225, the next expansion target is 4,244. 3. Support 4,172 – 4,155 (Fibo 0.5 – 0.618): Nearest support, likely to see a reaction. 4,127 – 4,130: The strongest support zone, aligned with the ascending trendline → a potential buying area. 4. Price Scenarios Scenario 1 (primary): Price retraces to retest 4,215–4,225, gets rejected → declines toward 4,155 or deeper to 4,127. Scenario 2: If the descending trendline breaks, price could rally strongly toward 4,244. BUY GOLD : 4127 - 4130 Stoploss : 4113 Take Profit : 100-300-500pips SELL GOLD : 4221-4224 Stoploss : 4233 Take Profit : 100-300-500pips