Technical analysis by ArmanShabanTrading about Symbol PAXG on 11/13/2025

ArmanShabanTrading
طلا پس از شکست ۴۲۰۰ دلار چه میشود؟ تحلیل گام بعدی XAU/USD
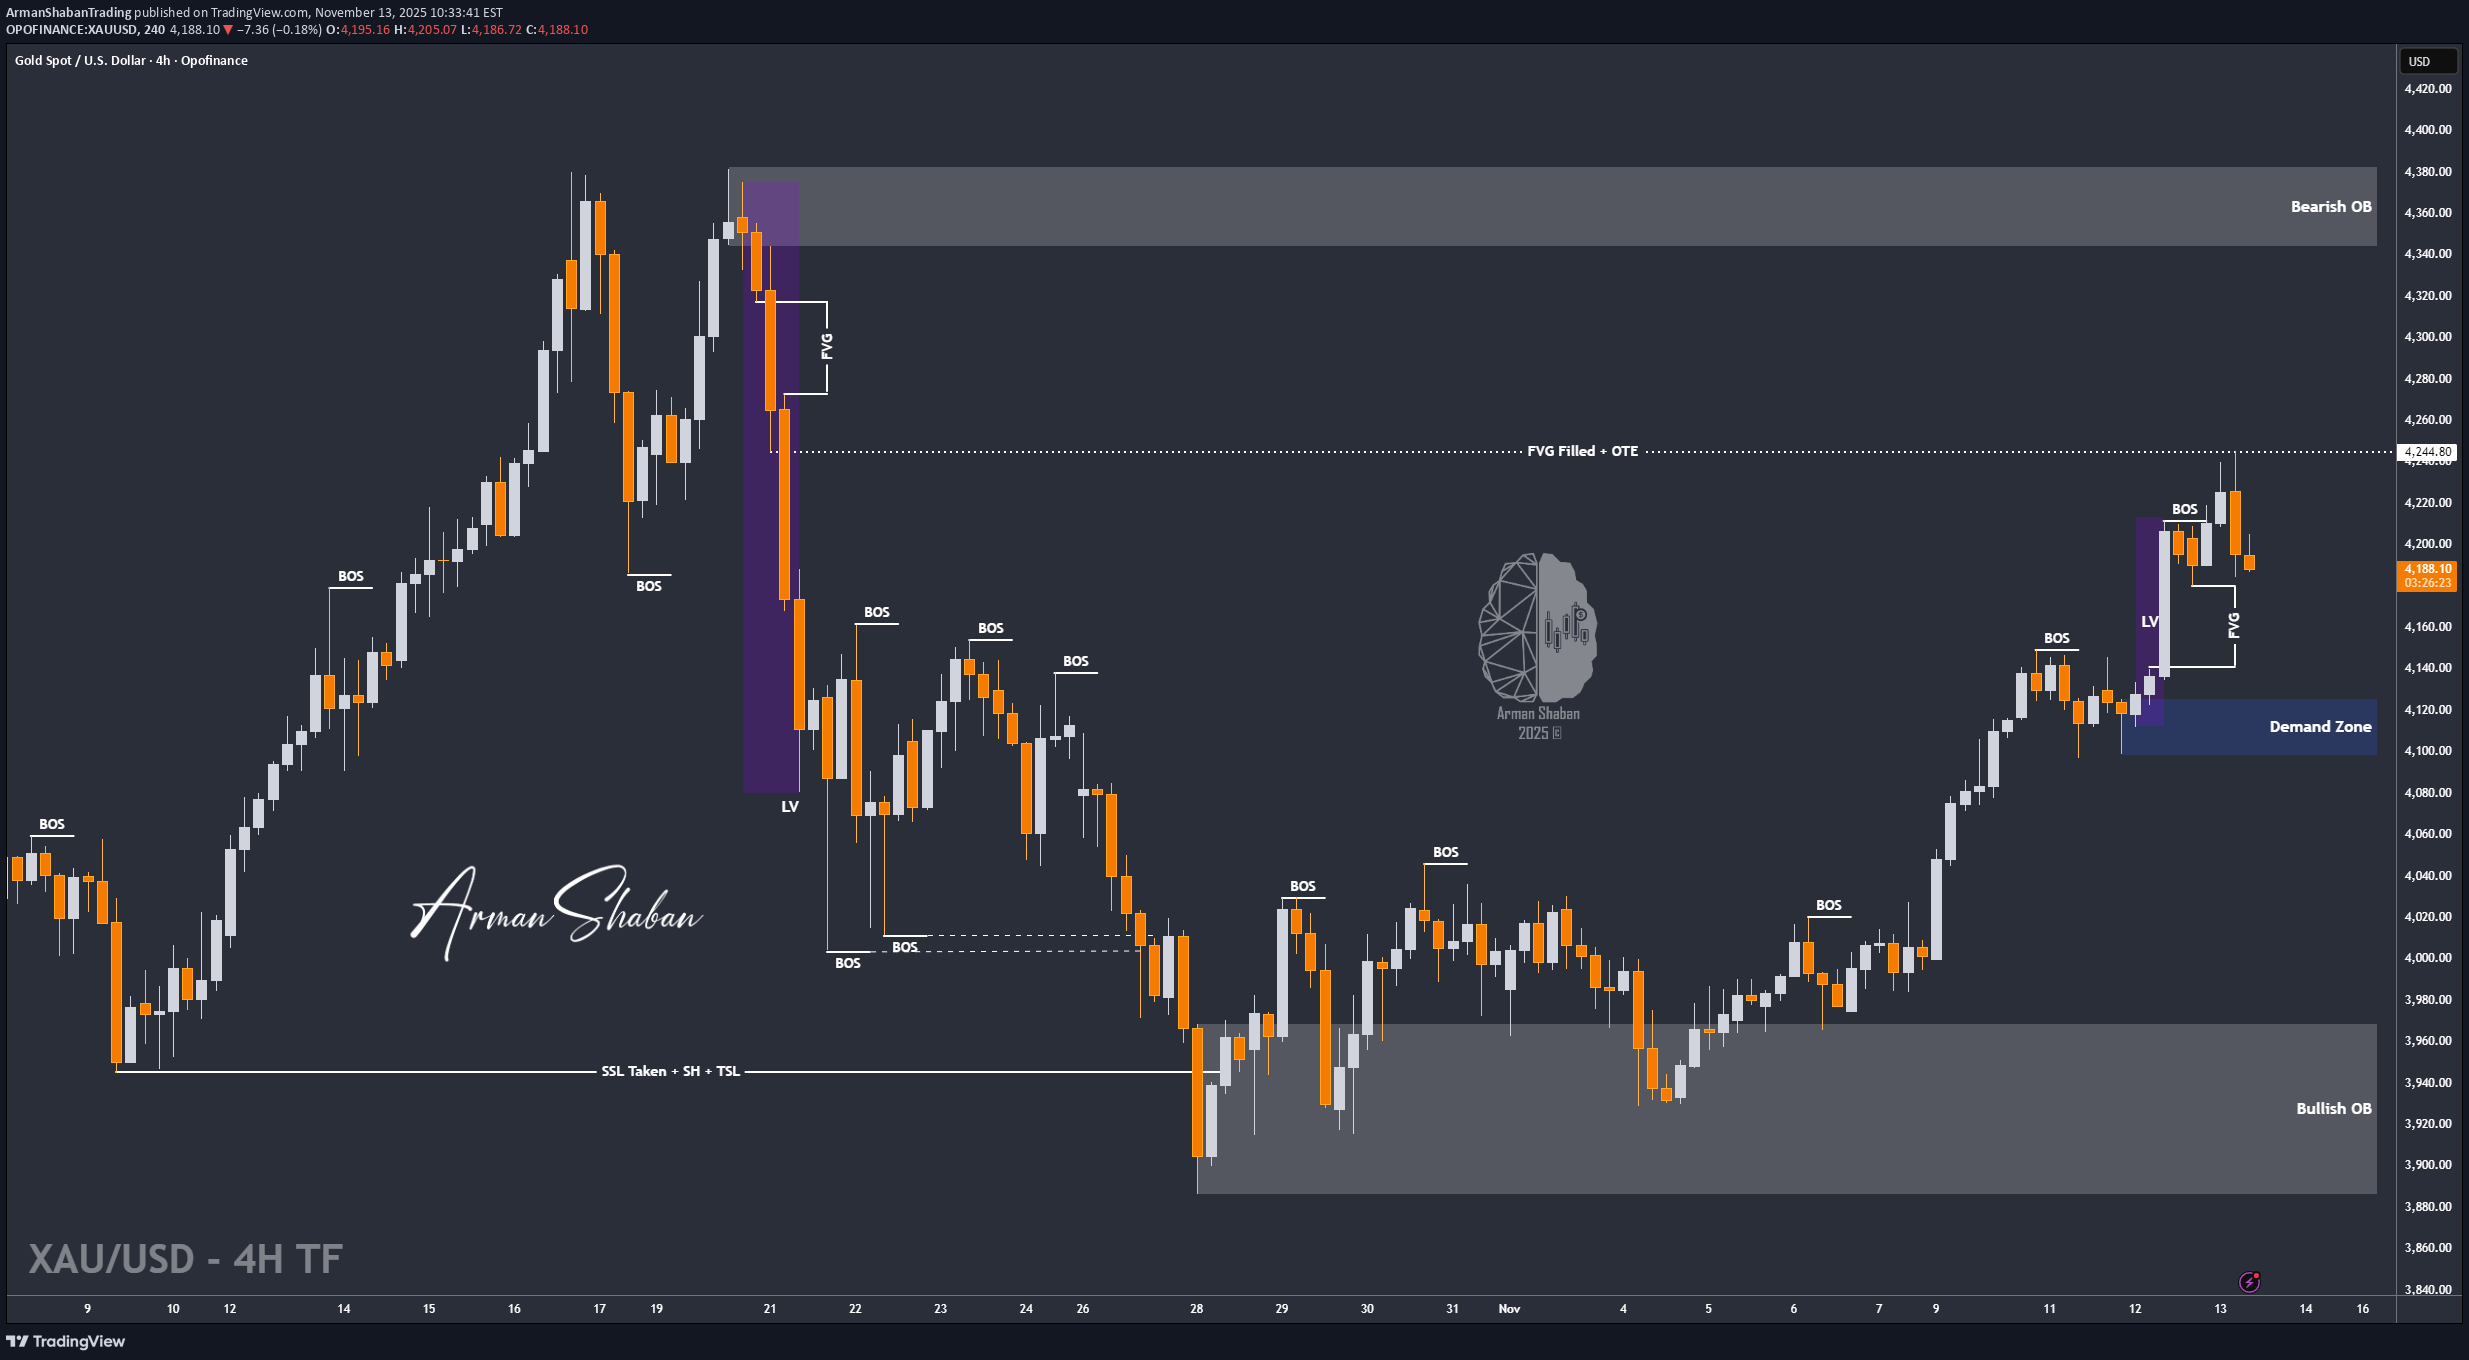
By analyzing the #Gold chart on the 4-hour timeframe, we can see that after breaking above the $4200 resistance, the price continued to rise and reached $4244 before reacting negatively from the OTE zone, correcting down to $4184. Gold is currently trading around $4195, with an FVG zone between $4141–$4181 that might get filled soon. There’s also a key demand area between $4098–$4125 to watch closely. If gold manages to hold above $4181 without breaking below, we could see another strong bullish move toward $4269. Monitor price reactions carefully at all mentioned levels! Please support me with your likes and comments to motivate me to share more analysis with you and share your opinion about the possible trend of this chart with me ! Best Regards , Arman ShabanBy analyzing the #Gold chart on the 4-hour timeframe, we can see that after filling the FVG zone between $4141–$4181, gold found demand and climbed to $4211. However, it then faced strong selling pressure, dropping over 1700 pips down to $4032. Currently, gold is trading around $4080. If a short-term rebound occurs, keep a close eye on the $4145–$4159 zone for a potential SELL opportunity. A detailed follow-up analysis will be posted soon!