Technical analysis by The_STA about Symbol PAXG on 11/10/2025

The_STA
استراتژی معاملاتی سودآور با MACD و RSI: رمزگشایی سیگنالهای خرید و فروش دقیق
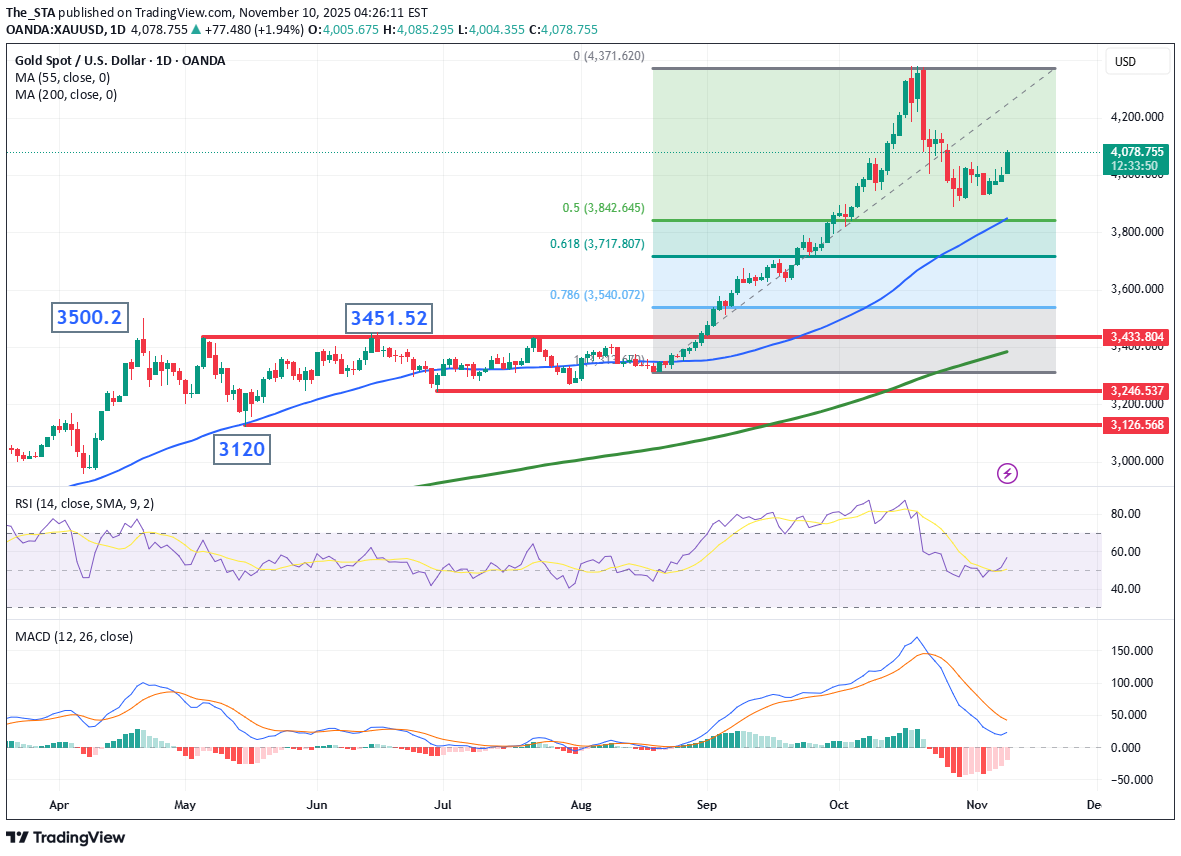
- MACD (12, 26, 9) — default settings - RSI (14) — Relative Strength Index 🟢 Buy Setup: - MACD Line crosses above the Signal Line — bullish momentum building. - RSI crosses above 50 — confirms strength behind the move. - Optional filter: Price above 50-day moving average for trend confirmation. 📈 Entry: On candle close after both conditions are met 🎯 Exit: When MACD crosses back below signal line or RSI drops below 50 🛑 Stop-loss: Below recent swing low 🔴 Sell Setup: - MACD Line crosses below the Signal Line — bearish momentum building. - RSI crosses below 50 — confirms weakness. - Optional filter: Price below 50-day moving average. 📉 Entry: On candle close after both conditions are met 🎯 Exit: When MACD crosses back above signal line or RSI rises above 50 🛑 Stop-loss: Above recent swing high Disclaimer: The information posted on Trading View is for informative purposes and is not intended to constitute advice in any form, including but not limited to investment, accounting, tax, legal or regulatory advice. The information therefore has no regard to the specific investment objectives, financial situation or particular needs of any specific recipient. Opinions expressed are our current opinions as of the date appearing on Trading View only. All illustrations, forecasts or hypothetical data are for illustrative purposes only. The Society of Technical Analysts Ltd does not make representation that the information provided is appropriate for use in all jurisdictions or by all Investors or other potential Investors. Parties are therefore responsible for compliance with applicable local laws and regulations. The Society of Technical Analysts will not be held liable for any loss or damage resulting directly or indirectly from the use of any information on this site.