Technical analysis by readCrypto about Symbol SOL on 11/9/2025

readCrypto
رمزگشایی محدوده حیاتی 161.79 تا 163.73 برای سولانا (SOL): نقطه عطف صعود یا سقوط؟
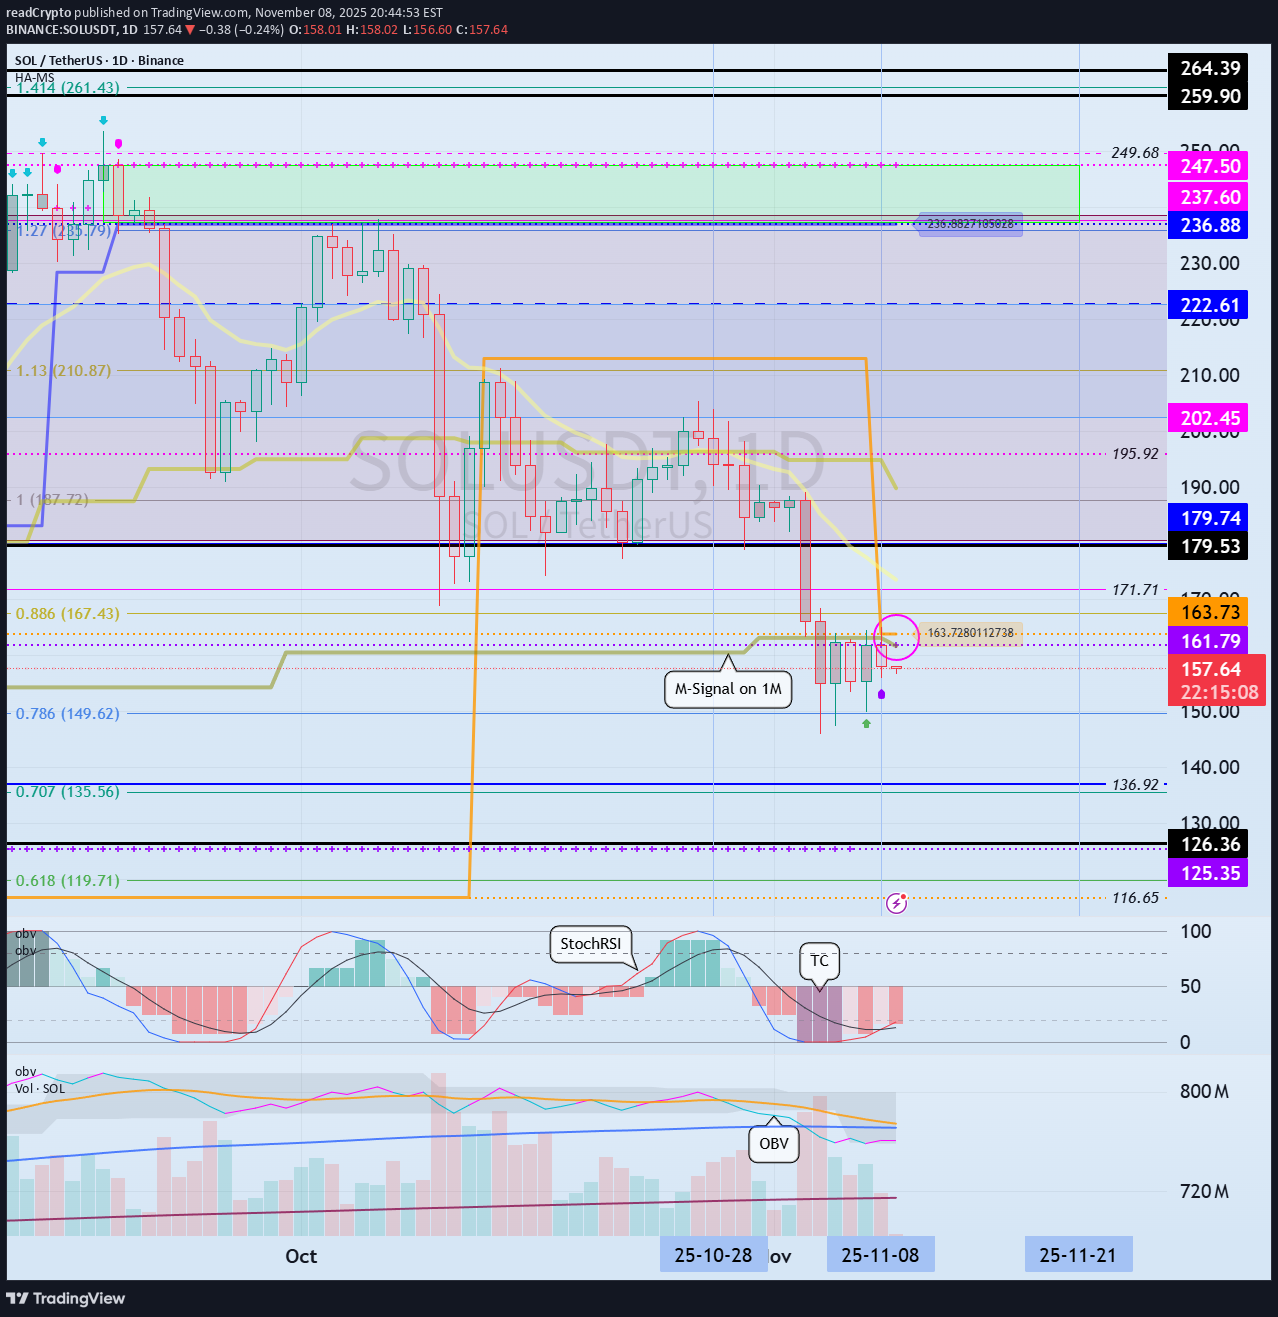
Hello, traders! Follow us to get the latest information quickly. Have a great day! ------------------------------------- (SOLUSDT 1D chart) The HA-Low indicator, the DOM(-60) indicator, and the M-Signal indicator are forming around 161.79-163.73. Therefore, the key is whether the price can break above the 161.79-163.73 level. To continue the uptrend by breaking above this key point or level, the StochRSI, TC (Trend Check), and OBV indicators must show upward trends. - The StochRSI indicator should not have entered the overbought zone. - The TC (Trend Check) indicator should remain above zero. - The OBV indicator should remain above the High Line. Currently, the OBV indicator is near the Low Line, and is in a reversed state with OBV < EMA 2 and EMA 1. Therefore, if the price breaks above the 161.79-163.73 level, we need to watch for a reversal where OBV > EMA2 and EMA1. The StochRSI indicator appears to be rising from the oversold zone, and appears to have shifted to a K > D state. The TC (Trend Check) indicator is trending upward, but since it's below the 0 level, we can see that selling pressure still dominates. Therefore, if the TC indicator breaks above the 161.79-163.73 level, we should also check to see if it can rise above the 0 level. If it fails to rise above the 161.79-163.73 level, we should check for support around 126.36. Since the HA-Low indicator has been created, even if it shows a stepwise downward trend, it is expected to eventually turn upward. Therefore, we should focus on finding the right time to buy. - Thank you for reading to the end. I wish you successful trading. --------------------------------------------------