Technical analysis by HoneySpotTrading about Symbol ETH: Sell recommendation (11/8/2025)

HoneySpotTrading
تحلیل تکنیکال اتریوم (ETHUSD): آمادهسازی برای سقوط بزرگ پس از جمعآوری نقدینگی!
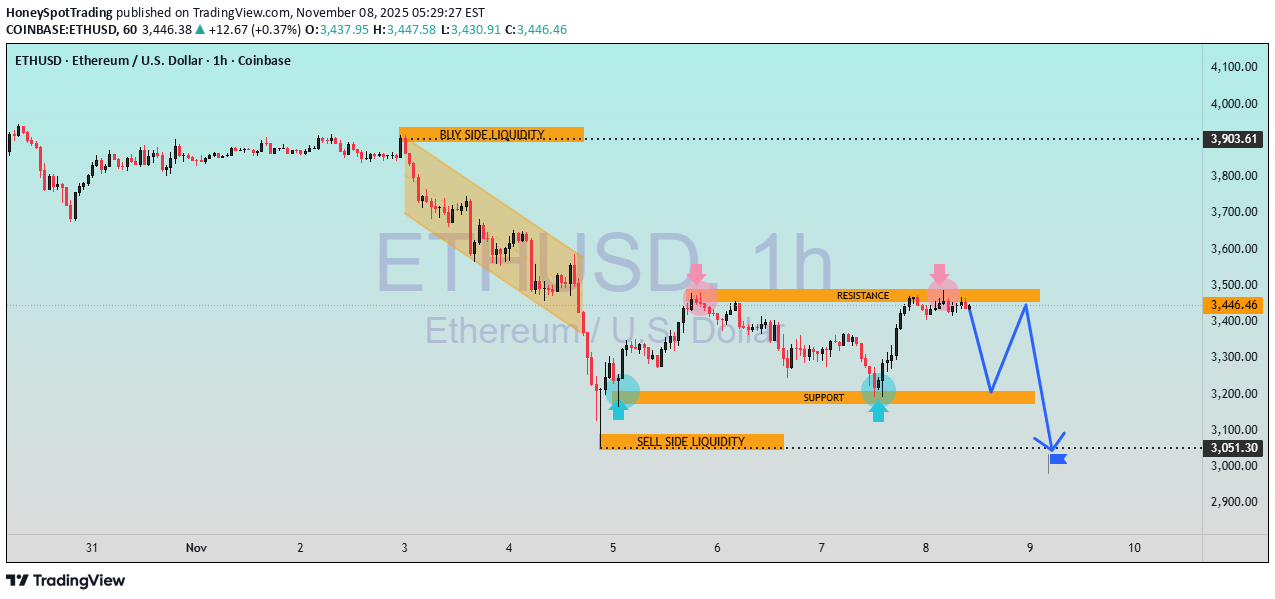
ETHUSD – 1H Timeframe Analysis | Liquidity Grab & Bearish Continuation Scenario In this chart, Ethereum (ETHUSD) is currently trading near the $3,440 level after tapping into a strong resistance zone where buy-side liquidity has been collected. Price previously swept the highs, indicating potential exhaustion in bullish momentum. 🔍 Key Technical Observations ✅ Buy-Side Liquidity Sweep Price moved into the upper liquidity zone and quickly rejected. Indicates institutions may have gathered liquidity for a downside move. ✅ Resistance Zone – Strong Supply Area Multiple rejections from the orange resistance block. Sellers are defending this area aggressively. ✅ Support Zone – Demand Area Around $3,250 – $3,200, price previously reacted with bullish wicks. Blue arrows show buyers stepping in temporarily. ✅ Sell-Side Liquidity Below A clean downside target remains near $3,050. Liquidity pools below indicate unfinished business. 📉 Market Structure Outlook The projected movement suggests: Short-term bearish rejection from resistance. Possible retest of support near $3,250. If support breaks ➝ downside continuation towards $3,050 liquidity zone. This aligns with a lower-high formation and a continuation of the existing downtrend. 🎯 Bearish Scenario Entry: On bearish confirmation below support zone Target: $3,050 Invalidation: Sustained breakout above $3,500 resistance