Technical analysis by Nabi_Gunduz about Symbol PAXG on 11/8/2025

تحلیل طلا (ONS ALTIN): آیا ریزش ادامه دارد یا خبری از صعود است؟
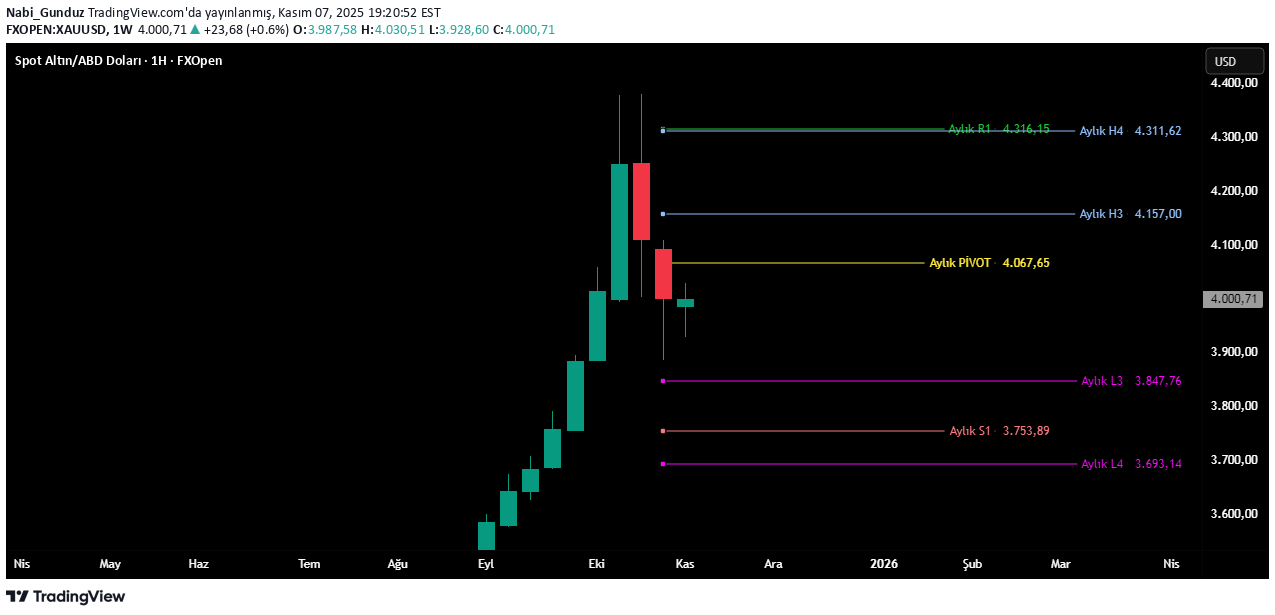
Hello, I would like to start by briefly touching on the monthly closing review that I was unable to make last weekend. For the first time this year, the price closed below and opened below the monthly pivot level of the new month. This is an issue that should be given great importance. As can be seen in our main chart, the monthly pivot level for November is 4067.65, and as long as the price remains below this level, or in other words, unless there is a weekly candle closing above the monthly pivot level, the possibility of decline will continue. As a matter of fact, during the first week of November, the price moved below the monthly pivot level and closed the week below the monthly pivot level. On the other hand, the weekly pivot level for next week is 3986.65. Since the last closed daily candle was above this level, it would not be technically correct to say that the price moving under the monthly pivot will continue in a downward direction without seeing a daily candle close below 3986.65. If a daily candle closes under the weekly pivot in the new week, we can think that a new downward wave may occur since the price is also under the monthly pivot. Now let's analyze what may happen next week with the formations in daily and 4-hour time frames... In this chart on the daily time frame, you see the FVG zones. A daily candle closing on the FVG zone, seen in pink with the range of 4043.73-4019.60, may turn this zone into a support zone and cause the price to rise towards the next FVG/IFVG zones. The FVG region seen in green on the chart is an FVG region in the weekly time frame and we may be talking about completely different things after the weekly candle closing under this region. Because the region is the last upward FVG region on a weekly basis and its downward break may deepen the decline. Just like the last rise in the pink zone above on the chart, the decline deepened after the blue zone, which is the ifvg zone, broke downward on a daily basis, this time there will be a possibility of a similar situation on a weekly basis... In this chart, which is also in the daily time frame, there is a downward formation that has produced a signal and reached the TP1 level, and two upward formations that have not yet formed a signal. In order for bullish formations to generate signals, it is necessary to see a daily candle close above 4046. Since an upward break of this level will fulfill the upward break condition of the FVG region in the previous chart, there is a high probability that the price will rise after such a break... In this chart, which is in the 4-hour period, the price reached the TP1 level after the downward formation seen in red produced a signal, and the buying signal was formed after the upward formation seen in pink was formed and this formation reached the TP1 level. As I mentioned before, when the formations start to return from TP1 levels before reaching their main targets, it indicates that the price is indecisive or the price may consolidate... These are the periods when those who do not perform correct risk and margin management suffer the most. CONCLUSION: There is no clarity that I can say with peace of mind that the price can go in this direction. I hope you all have a nice weekend...