Technical analysis by isahebdadi about Symbol BTC: Buy recommendation (11/7/2025)

isahebdadi
بیت کوین در مرز سرنوشت: آیا قیمت به ۱۲۰ هزار دلار میرسد یا سقوط میکند؟
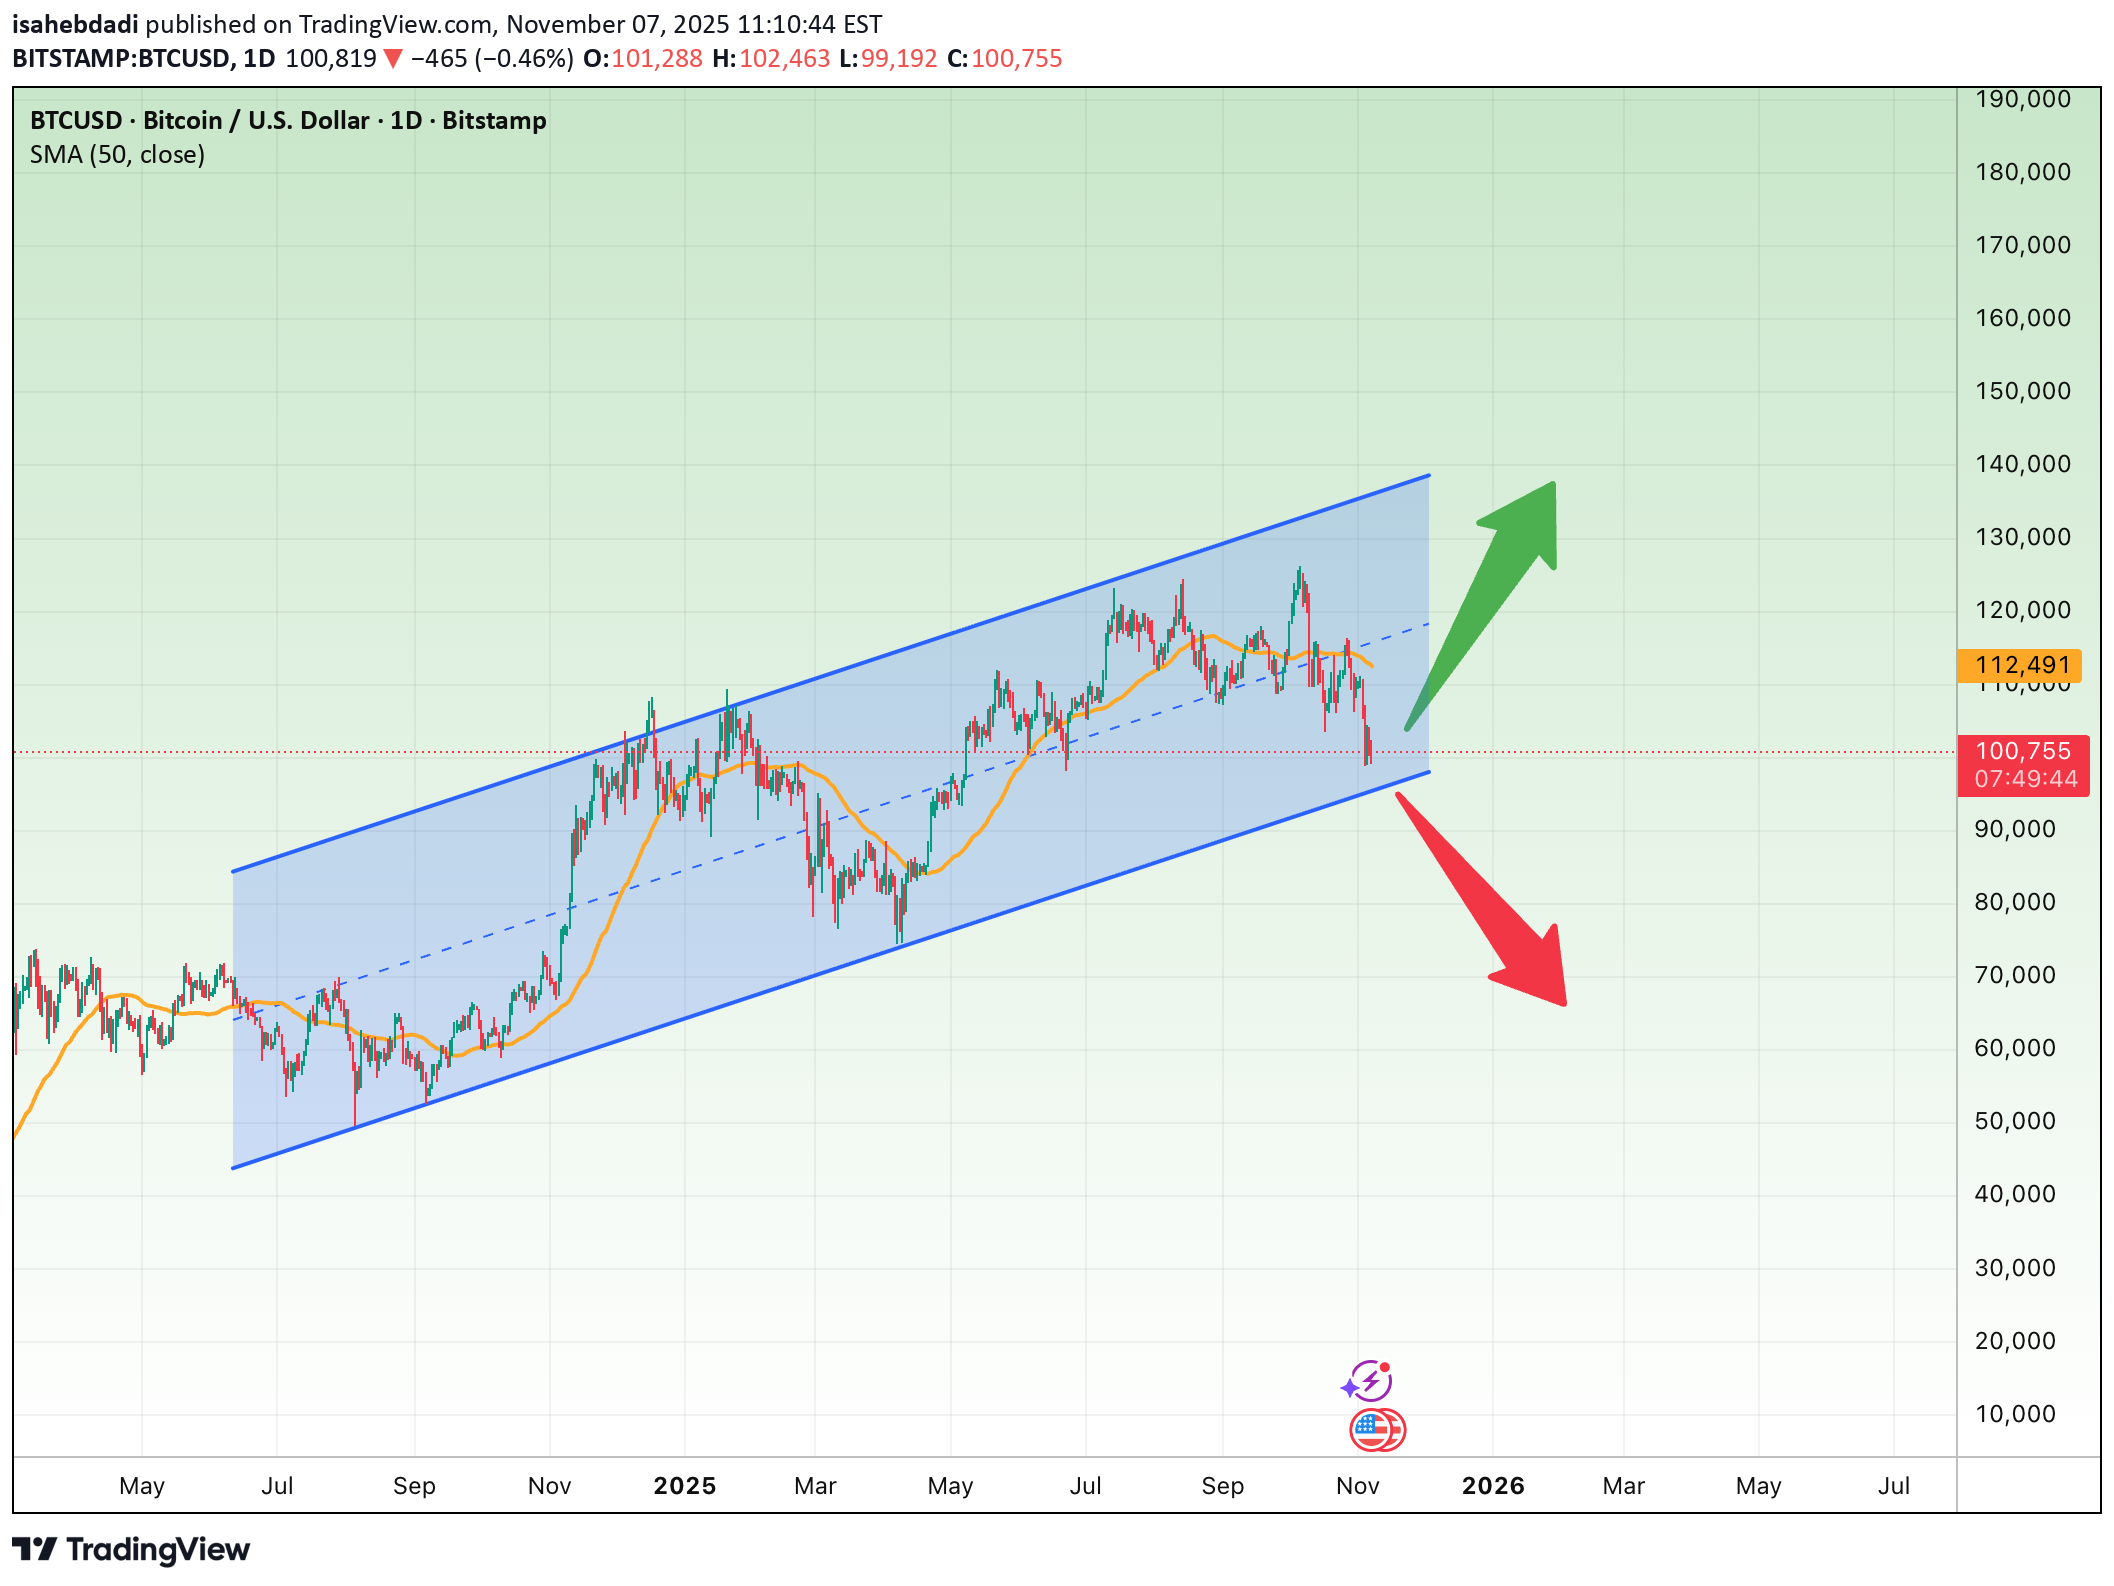
The daily chart shows Bitcoin trading within a well-defined ascending channel for several months and now testing its lower boundary around the $100,000–$105,000 zone — a crucial structural support that also aligns with the 50-day moving average (SMA50). Bullish Scenario: If Bitcoin holds above $100,000 and forms a bullish reversal candle, a rebound toward $120,000–$135,000 is likely. A confirmed breakout above $120,000 could trigger a new upward wave toward a fresh all-time high. Bearish Scenario: If the $100,000 support fails, the next downside targets are around $90,000 and $80,000. A confirmed breakdown below $80,000 would signal a shift to a medium-term bearish trend. Summary : The $100K zone represents the dividing line between trend continuation and a deeper correction. As long as Bitcoin stays above $90,000, the overall market structure remains bullish.