Technical analysis by MR_gold2 about Symbol PAXG: Sell recommendation (11/4/2025)

MR_gold2
طلاء الذهب ينهار؟ تحليل مفاجئ يحدد قاع التصحيح القادم!
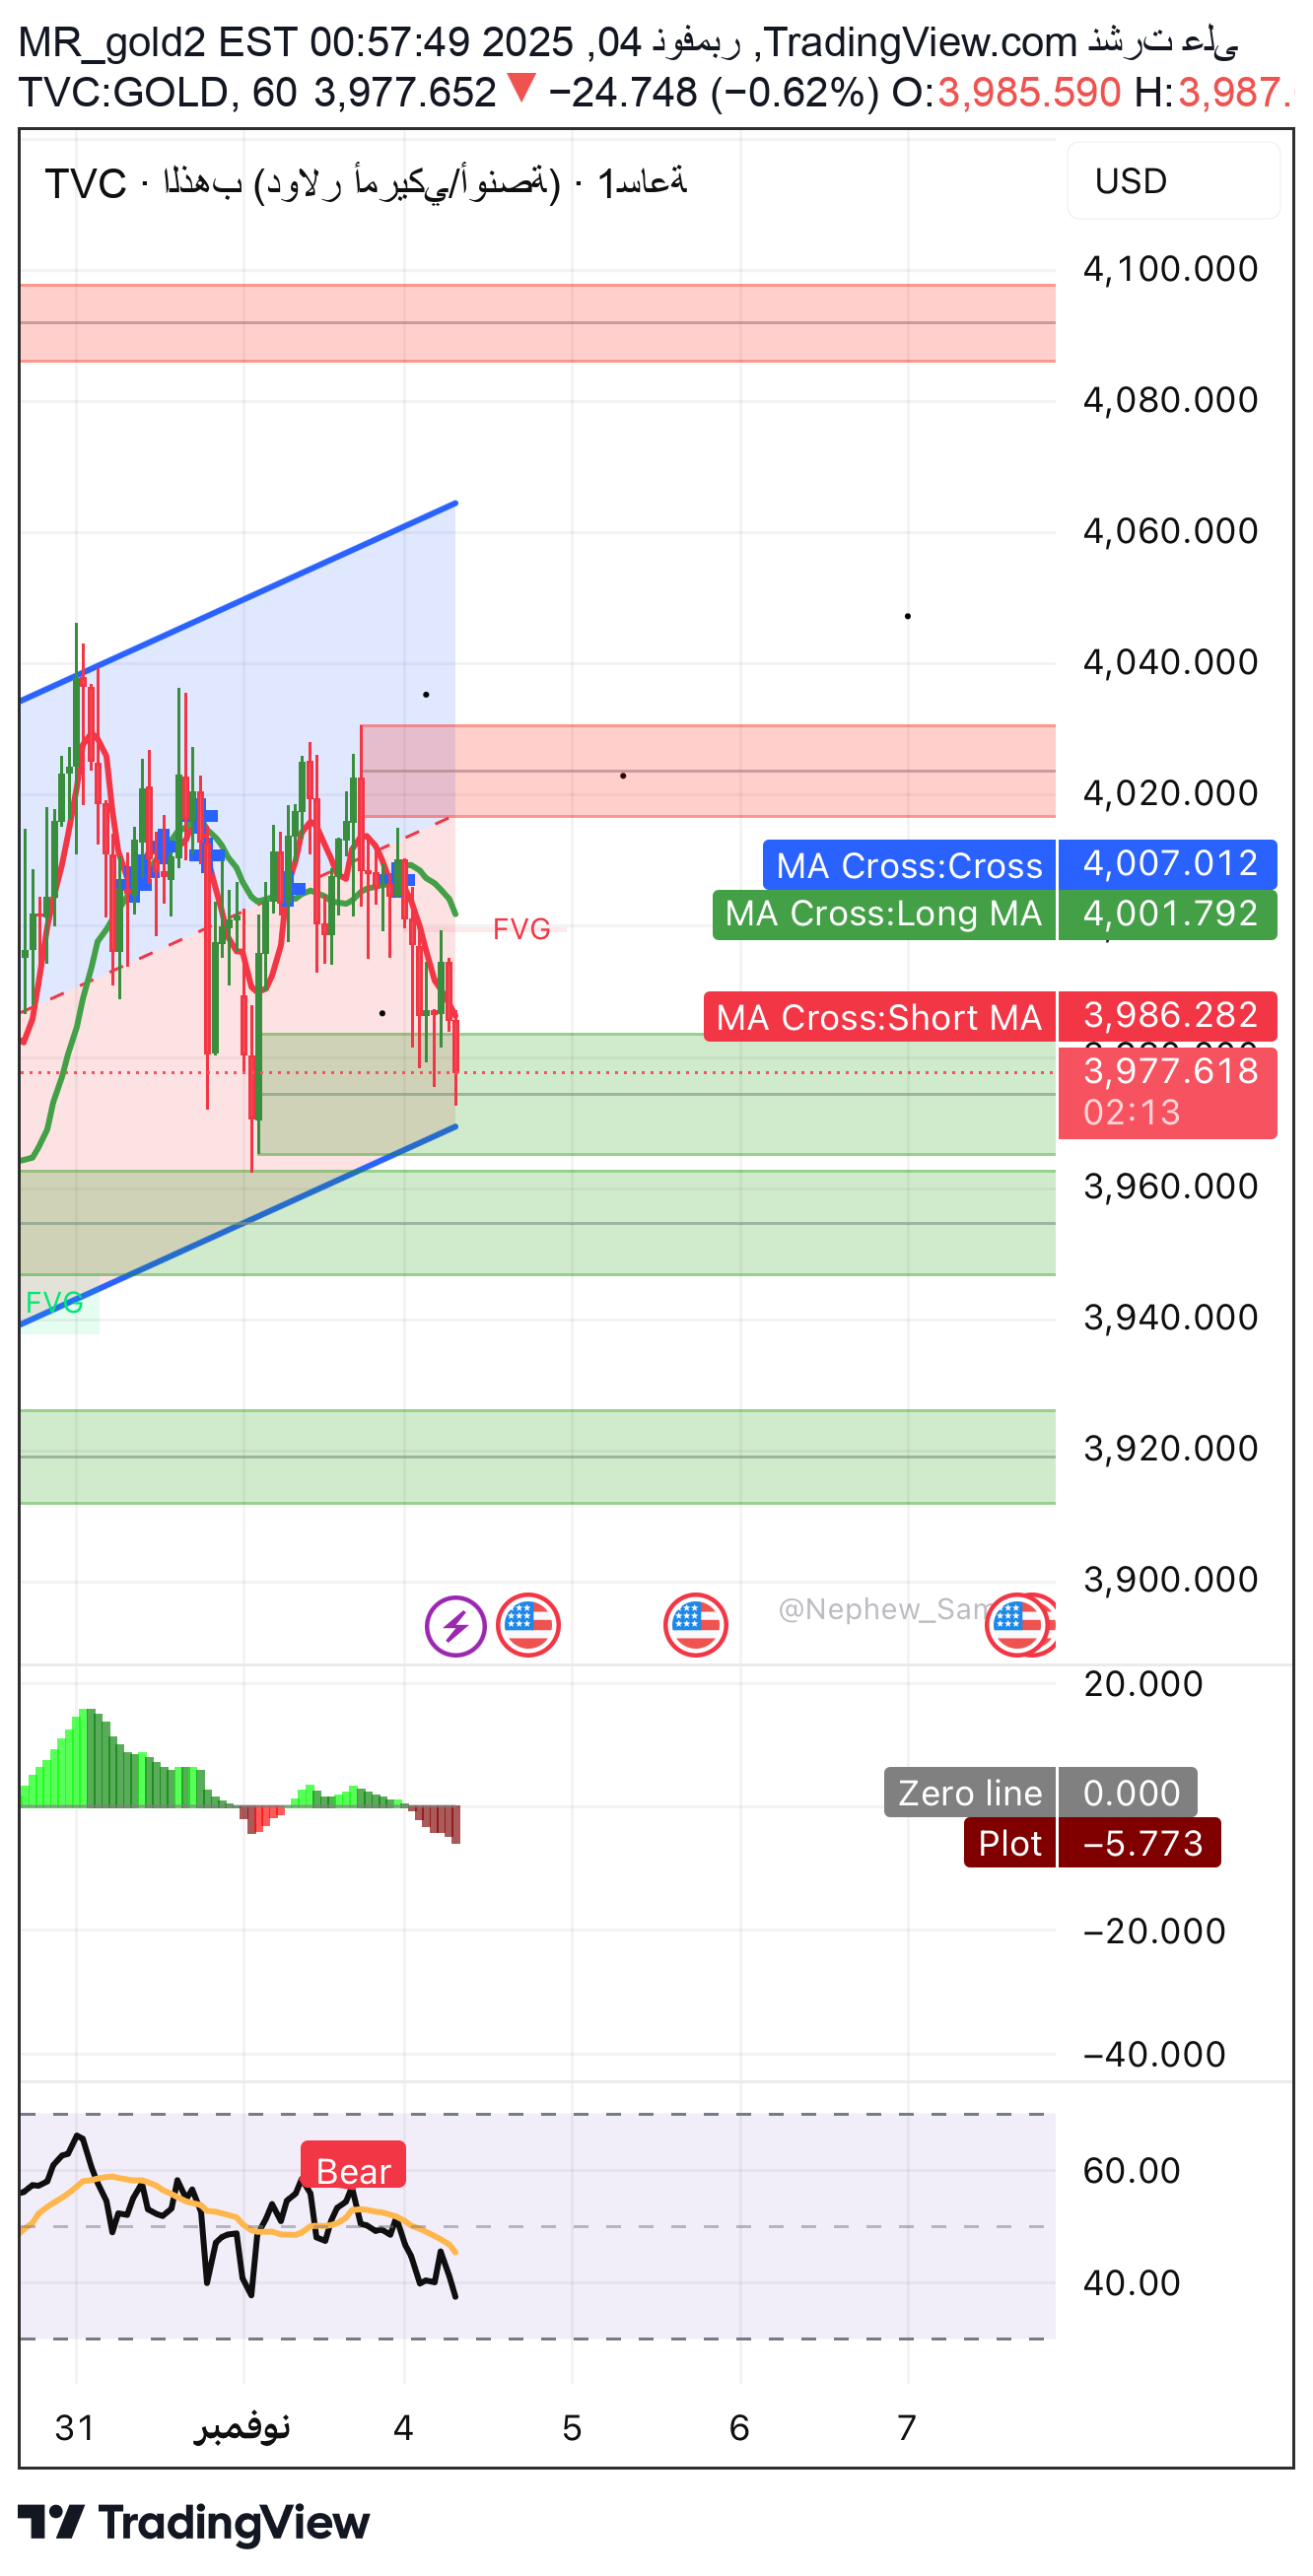
� Technical analysis: •The price is moving within a minor ascending channel that started from the bottom 3,845. •We note that the price tested the lower border of the ascending channel more than once, and is now pressing it again, which indicates the possibility of breaking it in the coming hours. •The momentum indicator at the bottom (Histogram) is gradually turning into increasingly negative territory, strengthening the control of short-term sellers. •Moving averages: ◦Short MA < Long MA → negative signal. ◦Touching at the previous 4,000 level confirms the temporary loss of upward momentum. • 🔶 Wave analysis: •The current wave looks like a falling C wave from a larger ABC correction starting from 4,065. •The theoretical target of wave C according to Fibonacci measurements is 3,950–3,930. •In the event of a strong break below the current channel, it will turn into a fifth sub-impulse wave towards 3,920. 🔶 Chronological analysis: •According to the time cycle between peaks and troughs during the past week, a time cycle is formed approximately every 18-22 hours. •The price is now at the end of the current bearish cycle, which means that a temporary bottom may be recorded between 3,960 – 3,945 during the coming hours (before New York opens). •After that, a limited upward correction is expected before the next decision from the US Federal Reserve. 🔶 Digital analysis: •Pivot today: 4,001 •The price is currently trading below, reflecting a negative bias. Fibonacci levels: ◦0.618 of the previous bullish wave = 3,972 (now tested). ◦0.786 = 3,947 → Important digital time support. • 🔶 Fundamental analysis: •The market is awaiting US data this week regarding the Purchasing Managers’ Index and inflation. •The strength of the dollar and high bond yields are putting pressure on gold. •Physical demand from central banks remains supportive long-term, but does not prevent short corrections. •There is no immediate upward incentive unless negative US data is released. 🔶 Price action analysis: •The last candles show a failed breakout of the ascending channel with “Bearish Engulfing” candles. •The price behavior is currently bearish with weak attempts to buy. •Any bounce from current support is expected to be limited towards 3,995 maximum before completing the decline. 🔶 Supports and Resistances: First support 3,972 Major support 3,947 – 3,930 First resistance 3,995 Major resistance 4,015 – 4,035 ⸻ 🔶 Technical models: •An ascending channel is being broken → possible transformation into a bearish flag pattern. •If 3,970 is broken, the bearish pattern will be confirmed with targets towards 3,945 then 3,920. ⸻ 🔶 Digital and harmonic models: •A possible bullish Gartley pattern starting to form around 3,945 (expected point D). •The ideal point for a technical bullish bounce will be from 3,940–3,945, where demand areas + Fibonacci 0.786 + time support converge. ⸻ 🔶 Demand and supply areas: •Demand zone: 3,945 – 3,920 •Display area: 4,015 – 4,060 ⸻ 🔶 Fixation point and focal area: •Zone Pivot: 3,985 •Stability below = continuation of the downward trend. •A return above it = a corrective technical rebound towards 4,015. ⸻ 🔶 Recommendation: 📉 Sales scenario (most likely): •Search for sell signals From: 3,980 – 3,985 •Goals: 3,970 → 3,950 •Stop loss: 4,010 📈 Alternative purchasing scenario (in the event of a strong price rejection at 3,945): and the emergence of buy signals. •Entry: 3,950 •First goal: 3,995 •Second goal: 4,020 •Stop loss: 3,930