Technical analysis by MR_gold2 about Symbol PAXG: Buy recommendation (11/3/2025)

MR_gold2
تحلیل جدید طلا: آیا موج صعودی ادامه مییابد یا اصلاح در راه است؟
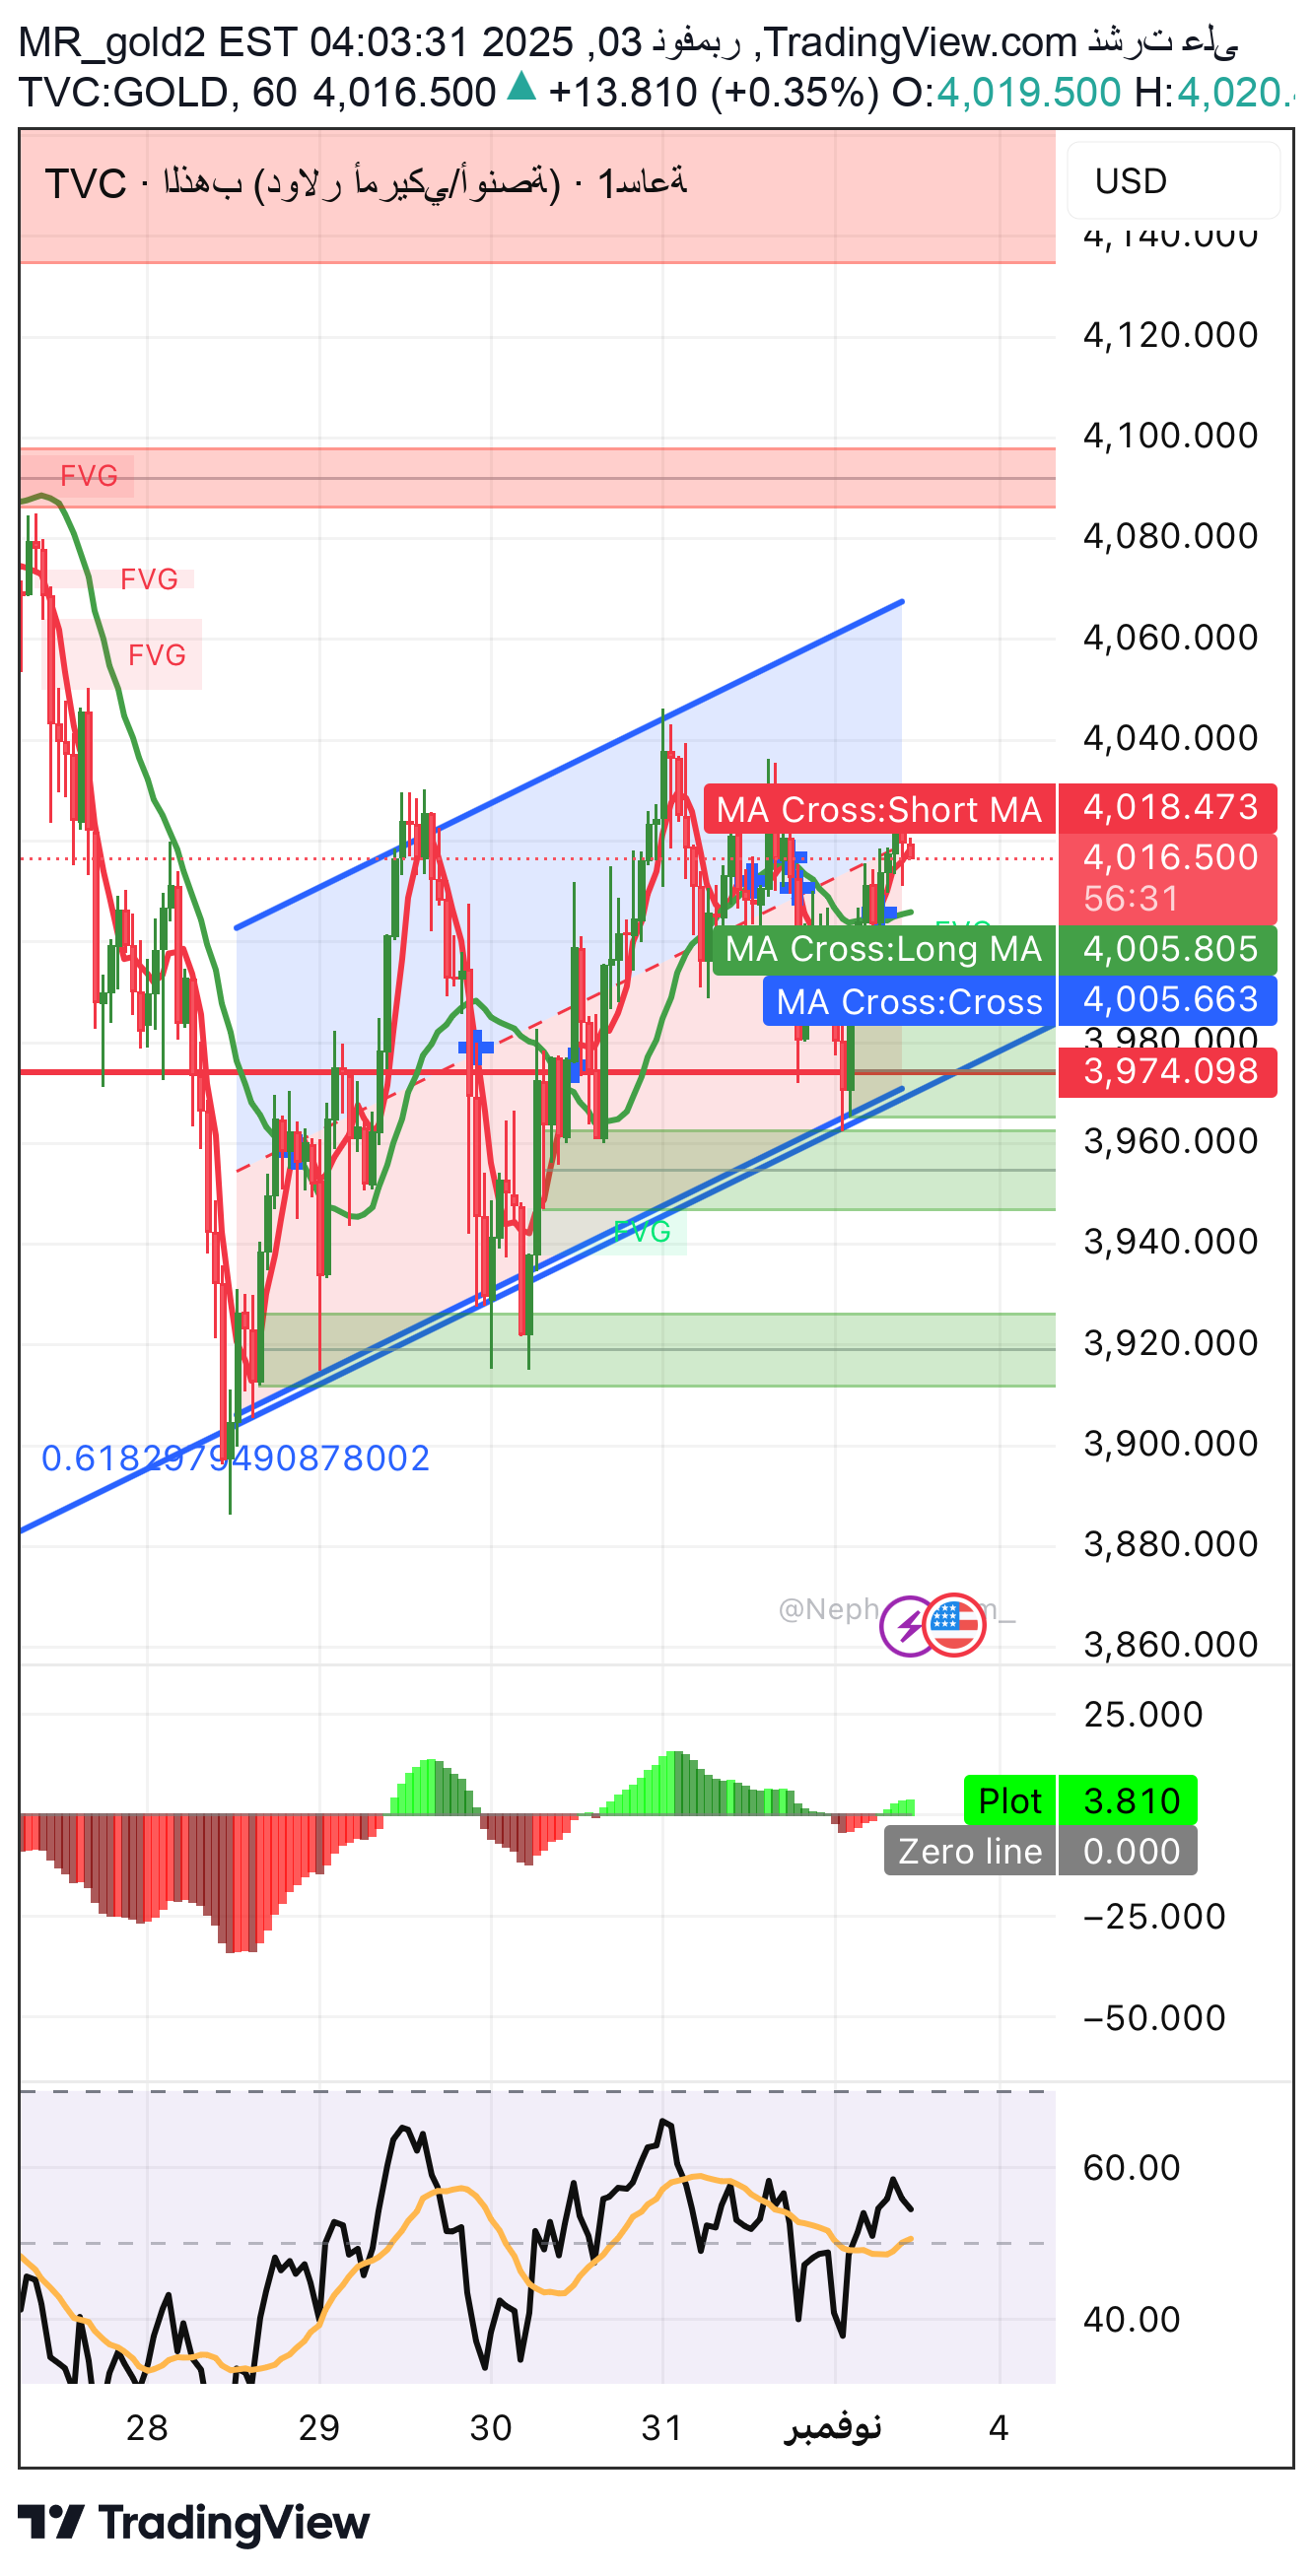
Many people have been sending me messages since Thursday, but no analysis was sent Because I see gold fluctuation in these areas, nothing new or a strong reaction to gold � Technical analysis: •The price is moving within a clear secondary ascending channel after breaking the previous downward trend. •The rising trend line (lower blue) still maintains positive momentum, and is currently forming an important dynamic support area around 3,975–3,980. •The moving averages (MA Cross) show a bullish overlap between the short and long lines around the 4,005 level, which enhances the possibility of continuing the rise as long as the price is above it. •The Momentum indicator at the bottom shows moderate positive momentum, with the beginning of an upward divergence on the RSI. 🔹 Wave analysis: •On the smaller (hourly) wave, the price is likely to form an upward ABC corrective wave within the larger wave. •The current wave represents wave C, which targets the 0.618–1.0 Fibonacci extension at 4,030 to 4,060. •Breaking the uptrend at 3,975 cancels the bullish scenario and confirms the entry of a new downward wave (the possibility of a wider correction for the second or fourth major wave). 🔹 Chronological analysis: •Chronologically, gold's current cycle shows a weekly bottom formed at the end of October, opening the way for a bullish movement until the middle of next week (around November 5-6). •The wave time indicates an area of oscillation before a new surge. 🔹 Digital analysis: •The daily pivot point is at 4,005. •Above it the trend is bullish, below it the trend turns neutral. Fibonacci levels: ◦0.382 at 3,985 ◦0.618 at 3,975 ◦Strong resistance at 4,060 (Fibo 1.0). • 🔹 Fundamental analysis: •Gold is currently supported by the decline of the dollar after the Federal Reserve’s recent statements that hinted at stabilizing interest rates. •On the other hand, there are no major inflationary data this week, which gives buyers a temporary opportunity to control the market. •Any statements from Fed members tending to tighten may restore negative pressure on gold. 🔹 Price action: •The last candles show the formation of the “bullish flag” pattern inside the channel. •The presence of bullish engulfing candles at the bottom of 3,950 indicates the entry of a strong demand. •Currently, the candle is trying to close above the green FVG area, which enhances the possibility of testing the 4,060 supply area. 🔹 Supports and Resistances: •Subsidies: 3,975 – 3,950 – 3,920 •Resistors: 4,030 – 4,060 – 4,120 🔹 Technical and digital models: •Bullish flag pattern inside an intermediate channel. •The golden ratio (Fibonacci 0.618) represents the base of movement at 3,975. •There is no completed harmonic pattern currently, but the price may head to form a possible Bat pattern if it bounces from 3,975 towards 4,120. 🔹 Demand and supply areas: •Strong demand zone: 3,950 – 3,975 •Main display area: 4,060 – 4,120 🔹 Fixation point and pivot area: •Central pivot point at 4,005 •The general trend is up as long as the close is above it. 🔹 Recommendation: 📈 Conditional buy above 4,005 •First goal: 4,030 •Second goal: 4,060 •Stop loss: Set it yourself according to the lot and entry area In case of breaking areas 3955 Wait for the retest and sell towards 3920 3880 Or if the hack fails: 📉 Sell from the display area 4,060 – 4,080 The condition for selling is the appearance of a reversal signal only •With a goal of 4,000 •Stop loss above 4,110 Important note We do not provide you with financial and investment advice Rather, we provide you with scientific and educational content You are the only person responsible for pressing the buy and sell button Analyst Engineer Ihab Sayed Al Thahab channel