Technical analysis by MR_gold2 about Symbol ETH: Buy recommendation (11/2/2025)

MR_gold2
پایان اصلاح اتریوم؟ موج پنجم صعودی در راه است!
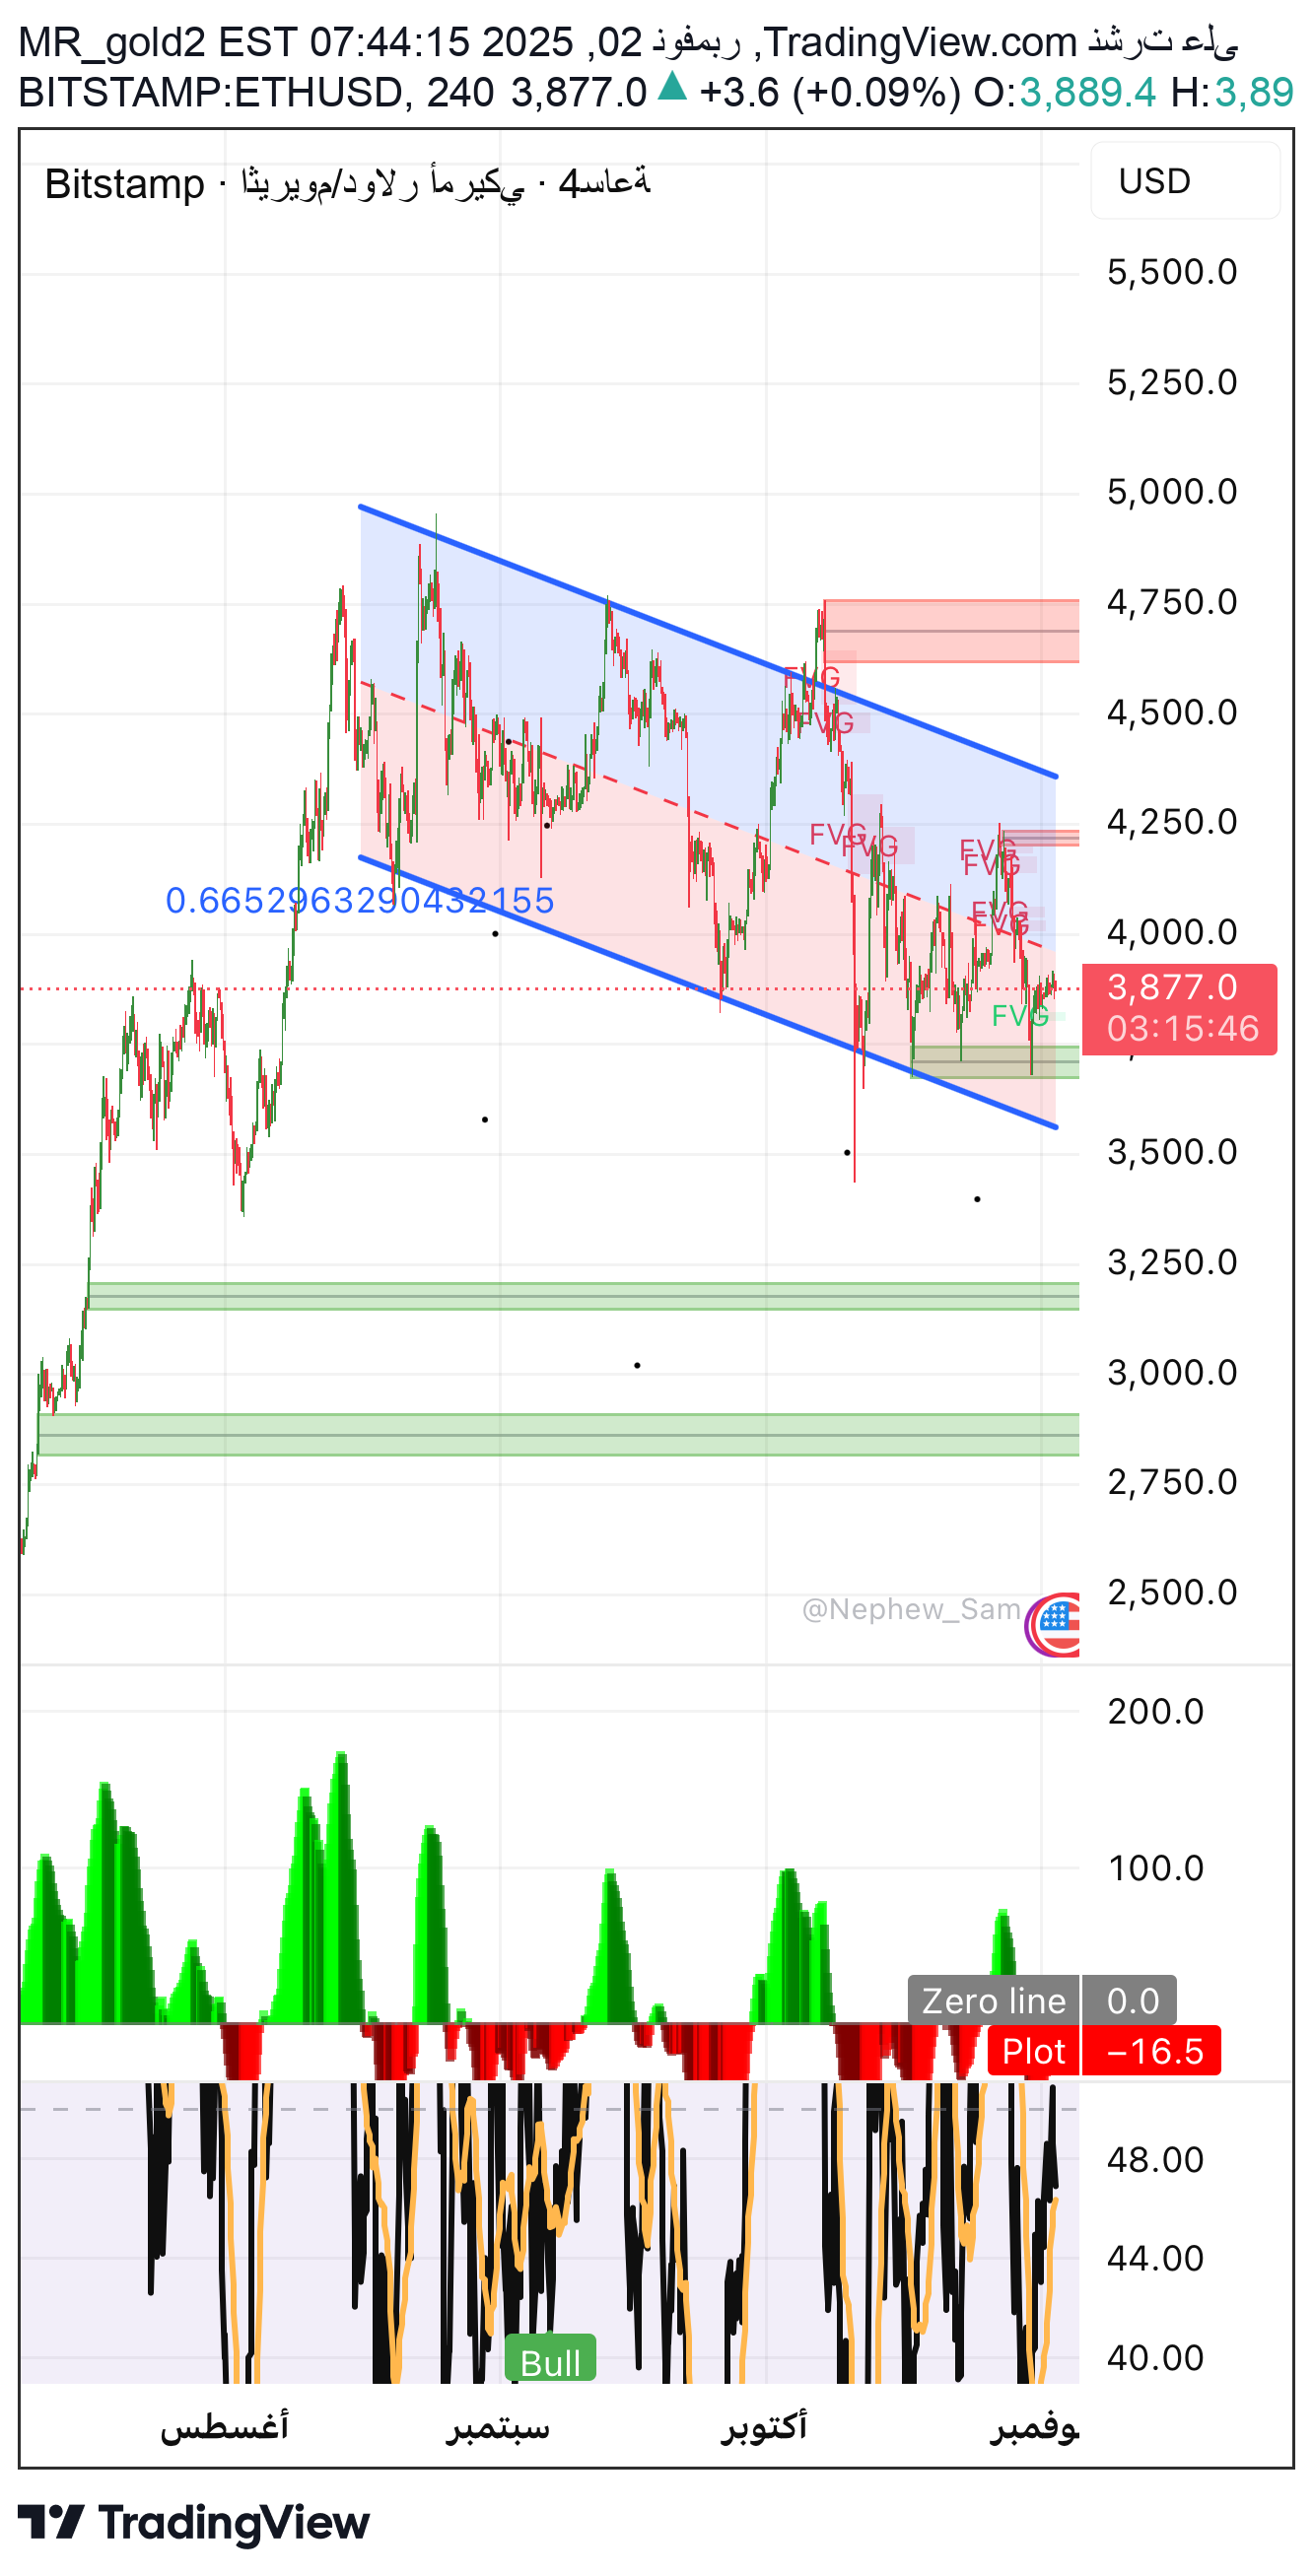
� General technical analysis Ethereum has been moving within a medium-term bearish channel since the last peak at $4,750, but is currently showing signs of a potential breakout above after a strong bounce from the $3,500 bottom. The price is trading roughly in the middle of the channel, with a balance between buyers and sellers, but the overall trend is gradually turning upward. 📊 The general trend: bullish in the medium term 📉 Short trend: sideways correction 📈 Next trend: Possible upside with a breach of 3,950 🔹 Wave analysis (Elliott Waves) Based on the current wave structure, it appears that Ethereum has finished the corrective wave (4) and is preparing to start wave (5) of the main impulse cycle: (1) 2,900 → 3,800 (2) 3,800 → 3,200 (3) 3,200 → 4,750 (4) 4,750 → 3,500 (finished) (5) 3,500 → 4,800 (expected) The fifth wave has already started from the 3,500–3,550 demand zone, and this is confirmed by the breakout of the blue descending channel line. ⸻ 🔹 Fibonacci Time Zones •The previous bearish wave lasted 17 trading days. •The current rising wave is in its fifth day, which means that we are in the first third of the new time cycle. ⏳ The timing of the completion of the fifth wave is expected to be within the next two weeks, with a gradual acceleration in momentum. ⸻ 🔹 Digital analysis (Fibonacci Levels). 0.382 3,750 Temporary subsidiary support 0.5 3,625 Strong support 0.618 3,500 Confirmed bottom and reversal zone 🎯 Potential upside stretch goals: •1.272 → 4,150 •1,414 → 4,350 •1.618 → 4,600 – 4,800 ⸻ 🔹Fundamental analysis •The ETH burn rate increased with increased activity on the network, reducing supply and creating positive inflationary pressure. •DeFi and L2s are in strong growth, boosting demand for gas (ETH). •Macro analysis: US inflation stability and the expectation of a rate cut support risky assets such as Ethereum. 📈 Fundamental outlook: Medium to long-term positive, especially with the price remaining above 3,500. ⸻ 🔹 Price Action •Successive bullish candles with long lower tails → clear price rejection below 3,600. •RSI at 53 → equilibrium with positive slope. •MACD has started a bullish crossover at the zero line → early confirmation of the reversal. •The price is forming Higher Lows, which indicates the formation of an emerging uptrend. ⸻ 🔹 Technical models •Falling channel representing the fourth correction → Breaking it upward opens the way for a strong fifth wave. •Inverse Head & Shoulders pattern is currently forming between 3,500 and 3,950 → Breaking the neckline at 3,950 gives a target towards 4,400. ⸻ 🔹Digital and harmonic models The Bullish Gartley pattern is forming on the 4-hour frame: •X = 4,750 •A = 3,500 •B = 4,000 •C = 3,650 •D = 3,500 📍 Reflection Zone (PRZ): 3,480 – 3,550 🎯 Objectives of the model: •1️⃣ 4,150 •2️⃣ 4,350 •3️⃣ 4,650 ⸻ 🔹 Demand and supply areas 🟩Demand areas: •3,500 – 3,550 (major support and rebound center) •3,250 – 3,300 (strong institutional demand) 🟥Supply areas: •4,000 – 4,100 (current sub-resistance) •4,350 – 4,450 (partial selling area for speculators) •4,750 – 4,800 (strong historical resistance) ⸻ 🔹 Fixation points and indicators •EMA 50: 3,780 → Nearby dynamic support. •EMA 200: 3,600 → strong strategic support. •RSI: steadily above the 50 line → stable uptrend. •MACD: Positive increasing momentum. ⸻ 🔹 Pivot Zone The area 3,780 – 3,950 is the key to the next stage: •Consistency above = start towards 4,400. •Break below it = correction towards 3,550 before rising again. ⸻ 🔹 Final recommendation (MrCrypto / Engineer Ihab) 🟢 Buy Setup Transaction: •Entry: 3,800 – 3,850 Objectives: •4,150 •4,350 •4,650 •Stop loss: 4-hour close below 3,600 🔴 Alternative scenario (additional correction): •If 3,600 is broken, return to buy near 3,500 with the same higher targets. 📈 Summary by Engineer Ihab Ethereum has completed its fourth correction and is preparing for the fifth upward wave, Stability above 3,800 means the beginning of a journey towards 4,400–4,800. Any drop below 3,600 represents a golden opportunity to accumulate before the start of the final wave Important note We do not provide you with financial and investment advice Rather, we provide you with scientific and educational content You are the only person responsible for pressing the buy and sell button Analyst Engineer Ihab Sayed Al Thahab channel