Technical analysis by cryptodailyuk about Symbol BTC on 11/1/2025

cryptodailyuk
تحلیل بیت کوین (BTC/USDT) در تایم فریم 1 ساعته: آیا صعود به سوی 113,900 آغاز میشود؟
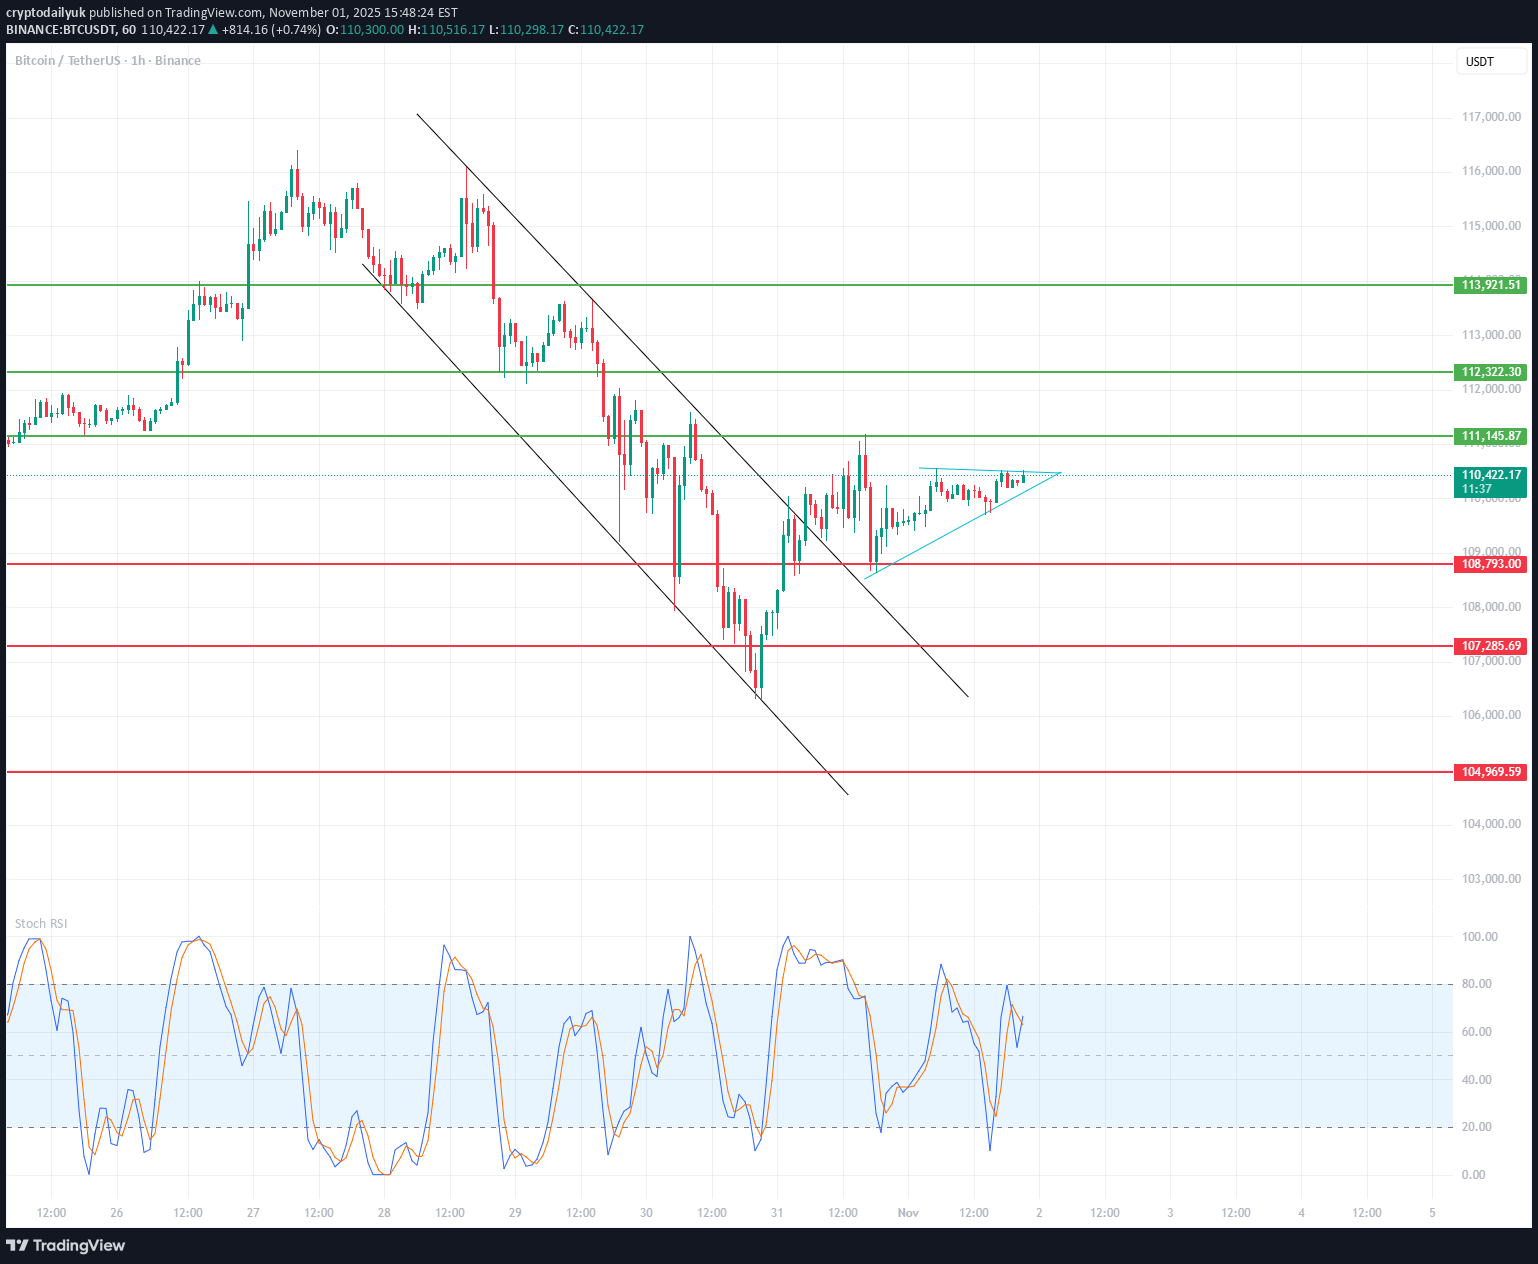
📉 Descending Channel (black lines) The price previously moved within a clear descending channel, which was broken upward. A breakout from the channel signals a change in the short-term trend – from supply pressure to an attempted rebound. From a technical perspective, a breakout from a descending channel often leads to an upward correction, the extent of which is at least the midpoint of the previous downward impulse. 🔷 Triangle Formation (blue lines) After breaking out of the channel, the price formed a symmetrical triangle (consolidation) – a sign of market indecision. Triangles of this type are often trend continuation patterns, but in this context – after a breakout from a descending channel – an upward breakout (i.e., a further upward rebound) is more likely. The key resistance level to watch is $111,145 – a breakout with volume confirmation would open the way to $112,320 and then $113,921. 🧭 Key Technical Levels Resistance: $111,145 – local resistance (upper boundary of the consolidation/triangle). $112,320 – another strong resistance level from the previous local high. $113,921 – major medium-term resistance. Support: $110,442 – lower boundary of the triangle (short-term support). $108,793 – support after the recent bounce. $107,285 – next demand level. $104,969 – bulls' defensive boundary in the broader context. 📊 Stoch RSI (bottom of the chart) The Stoch RSI oscillator is currently in a rebound phase from the neutral level (~40–60). If the lines (blue and orange) cross upwards and enter the zone above 80, this could confirm bullish momentum and a breakout from the triangle to the upside. However, a rejection from 60 and a further drop below 20 would signal a false breakout and a possible retest of USD 108,800. 🔎 Scenario Summary ➡️ Upside Scenario (more likely): Breakout from the triangle to the upside (confirmed by a 1-hour candle above USD 111,150). Potential move to USD 112,300 → USD 113,900. Momentum indicators support a rebound if the Stoch RSI maintains its upward trend. ⬇️ Downside scenario (alternative): Unsuccessful breakout and return below $110,400. A correction to $108,800 can then be expected, and if this level is broken, a further decline to $107,300.