Technical analysis by HoneySpotTrading about Symbol AAPLX: Sell recommendation (10/31/2025)

تحلیل تکنیکال اپل (AAPL): آیا ریزش در تایم فریم ۴ ساعته آغاز میشود؟
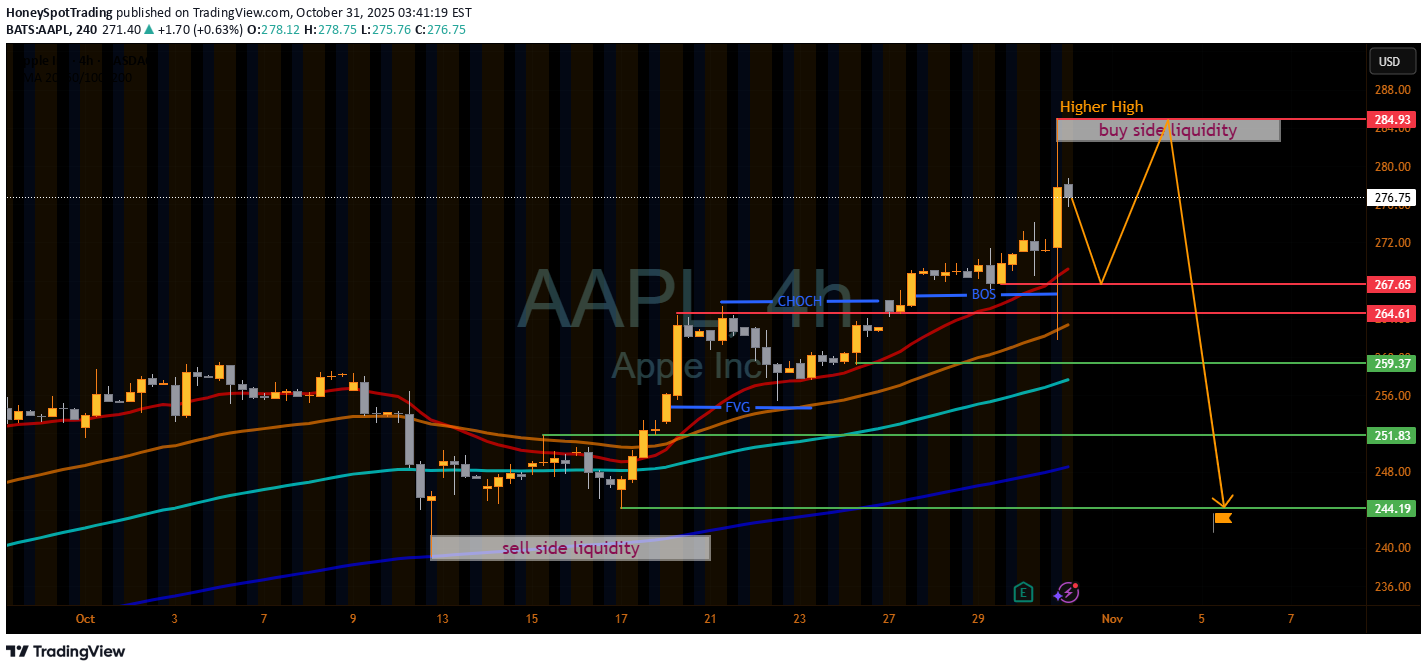
📌 AAPL Analysis – 4H Timeframe By analyzing the AAPL chart on the 4-hour timeframe, we can see that after taking Buy-Side Liquidity near 284.93 and forming a Higher High, price is showing signs of a potential reaction from this zone. If Apple fails to break and sustain above this level, we may see a short-term pullback toward the support area at 267.65 – 264.61. A strong break below this zone could open the way for a deeper decline toward 259.37 and even 251.83. The major downside liquidity target remains around 244.19, where we expect buyers to step back in. This analysis will be updated soon! Please support me with your likes and comments to motivate me to share more analysis with you and share your opinion about the possible trend of this chart with me! Best Regards, HoneySpotTrading