Technical analysis by bbqgio about Symbol TSLAX: Buy recommendation (10/30/2025)

احتمال انفجار قیمت تسلا (TSLA): آیا پرچم صعودی به سمت ۵۳۰ دلار میرسد؟
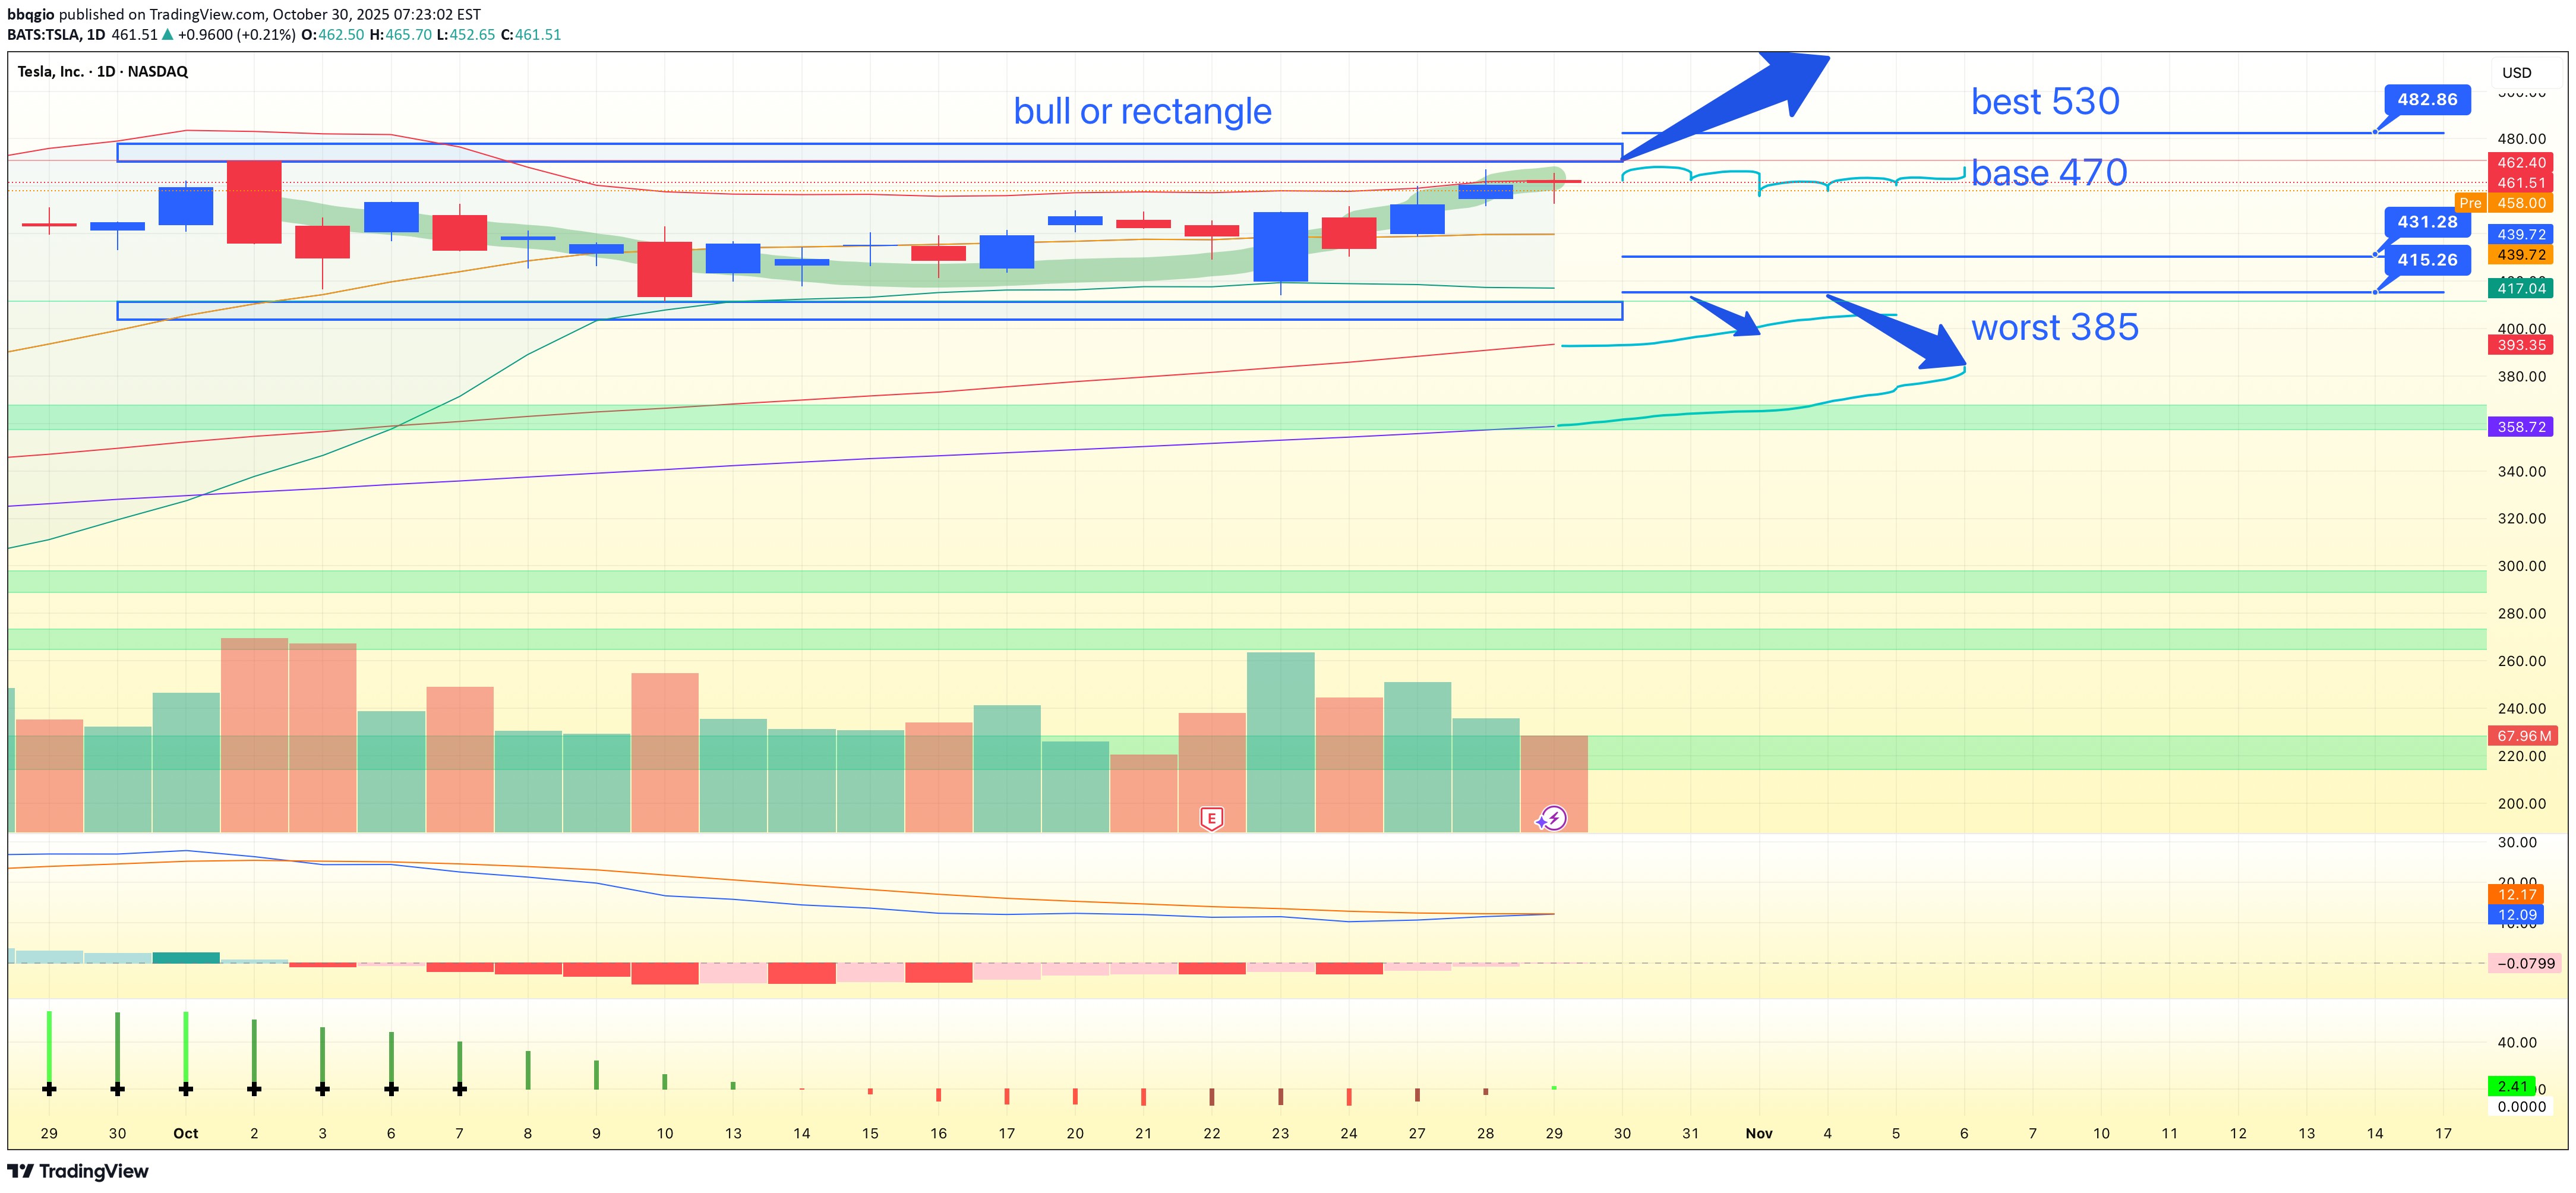
Hello, traders. TSLA’s 1D chart has been trending higher since the early-September breakout, then cooling into a neat bull flag. Price is holding above the MA20, MA60, and MA120, with the MA20 around ~$440 acting as first dynamic support. Volume expanded on the run-up and faded during the flag—classic continuation behavior—while volatility has eased but remains elevated. The key battleground is the resistance at $481, the early-October peak and upper boundary of the flag. A daily close above $482 would confirm the breakout and put the psychological $500 on the table, with extension toward the $525–$530 supply zone if momentum and volume expand. If buyers don’t force the break immediately, a dip toward the $430–$440 area (near MA20) is a constructive retest zone before another attempt at the highs. The idea fails on a decisive daily close below $415. That would break the flag support, flip the short-term structure, and expose downside toward the MA60 region near $390. Until then, the primary path favors continuation: breakout entries on a daily close >$482, with partial profits near $500 and runners into $525–$530; conservative stops live below $415–$417 depending on tolerance. This is a study, not financial advice. Manage risk and invalidations.