Technical analysis by Saitamasignal about Symbol BNB: Sell recommendation (10/30/2025)

Saitamasignal
تحلیل تکنیکال BNB/USDT: آیا سقوط به زیر ۹۰۰ دلار قطعی است؟
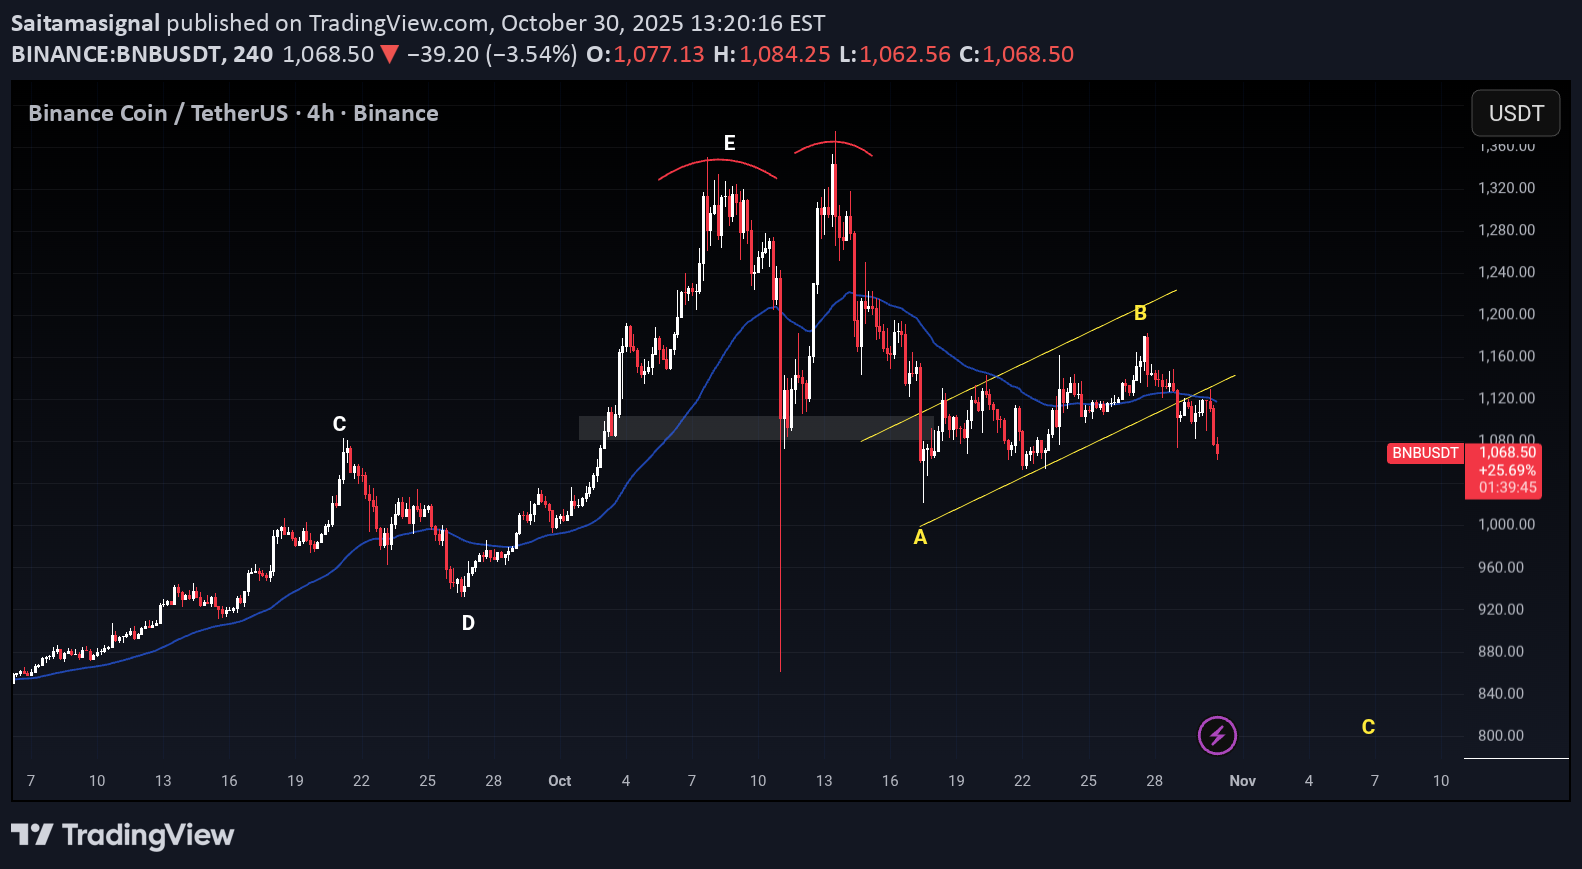
🧠 1. Market Structure The chart clearly shows a shift from bullish to bearish momentum. The double top pattern (E) indicates buyer exhaustion and signals a potential trend reversal. After the double top, price broke down below the neckline (grey zone) and failed to recover strongly. The market now appears to be forming a corrective ABC pattern, where: A = first corrective low B = weak retracement C = projected continuation of the downtrend 📉 2. Trend & Momentum Price is trading below the EMA (blue line) → clear bearish dominance. The rising channel (A–B) was broken to the downside, confirming that the retracement phase is over and the market is likely entering the C-wave decline. 📊 3. Technical Pattern & Targets Main pattern: Double top followed by an ABC corrective structure. Target projection (wave C): Usually measured by projecting wave A’s length from the top of wave B. Visually, potential target lies around $850–$900, assuming bearish pressure continues. ⚠️ 4. Key Levels Major resistance: $1,150–$1,200 (top of the channel & EMA zone). Support zones: $1,000 (psychological level), then $900–$850 (wave C target area). A break below $1,000 could accelerate the drop toward the $850 region. 💬 5. conclusion > Overall, the structure suggests a further corrective phase (Wave C) is developing. The "bearish flag breakdown" pattern supports the short-term bearish outlook.