Technical analysis by MR_gold2 about Symbol PAXG: Buy recommendation (10/29/2025)

MR_gold2
تحليل ذهب اليوم: ارتداد وشيك أم انهيار جديد؟ المستويات الحاسمة 4060 و 3940!
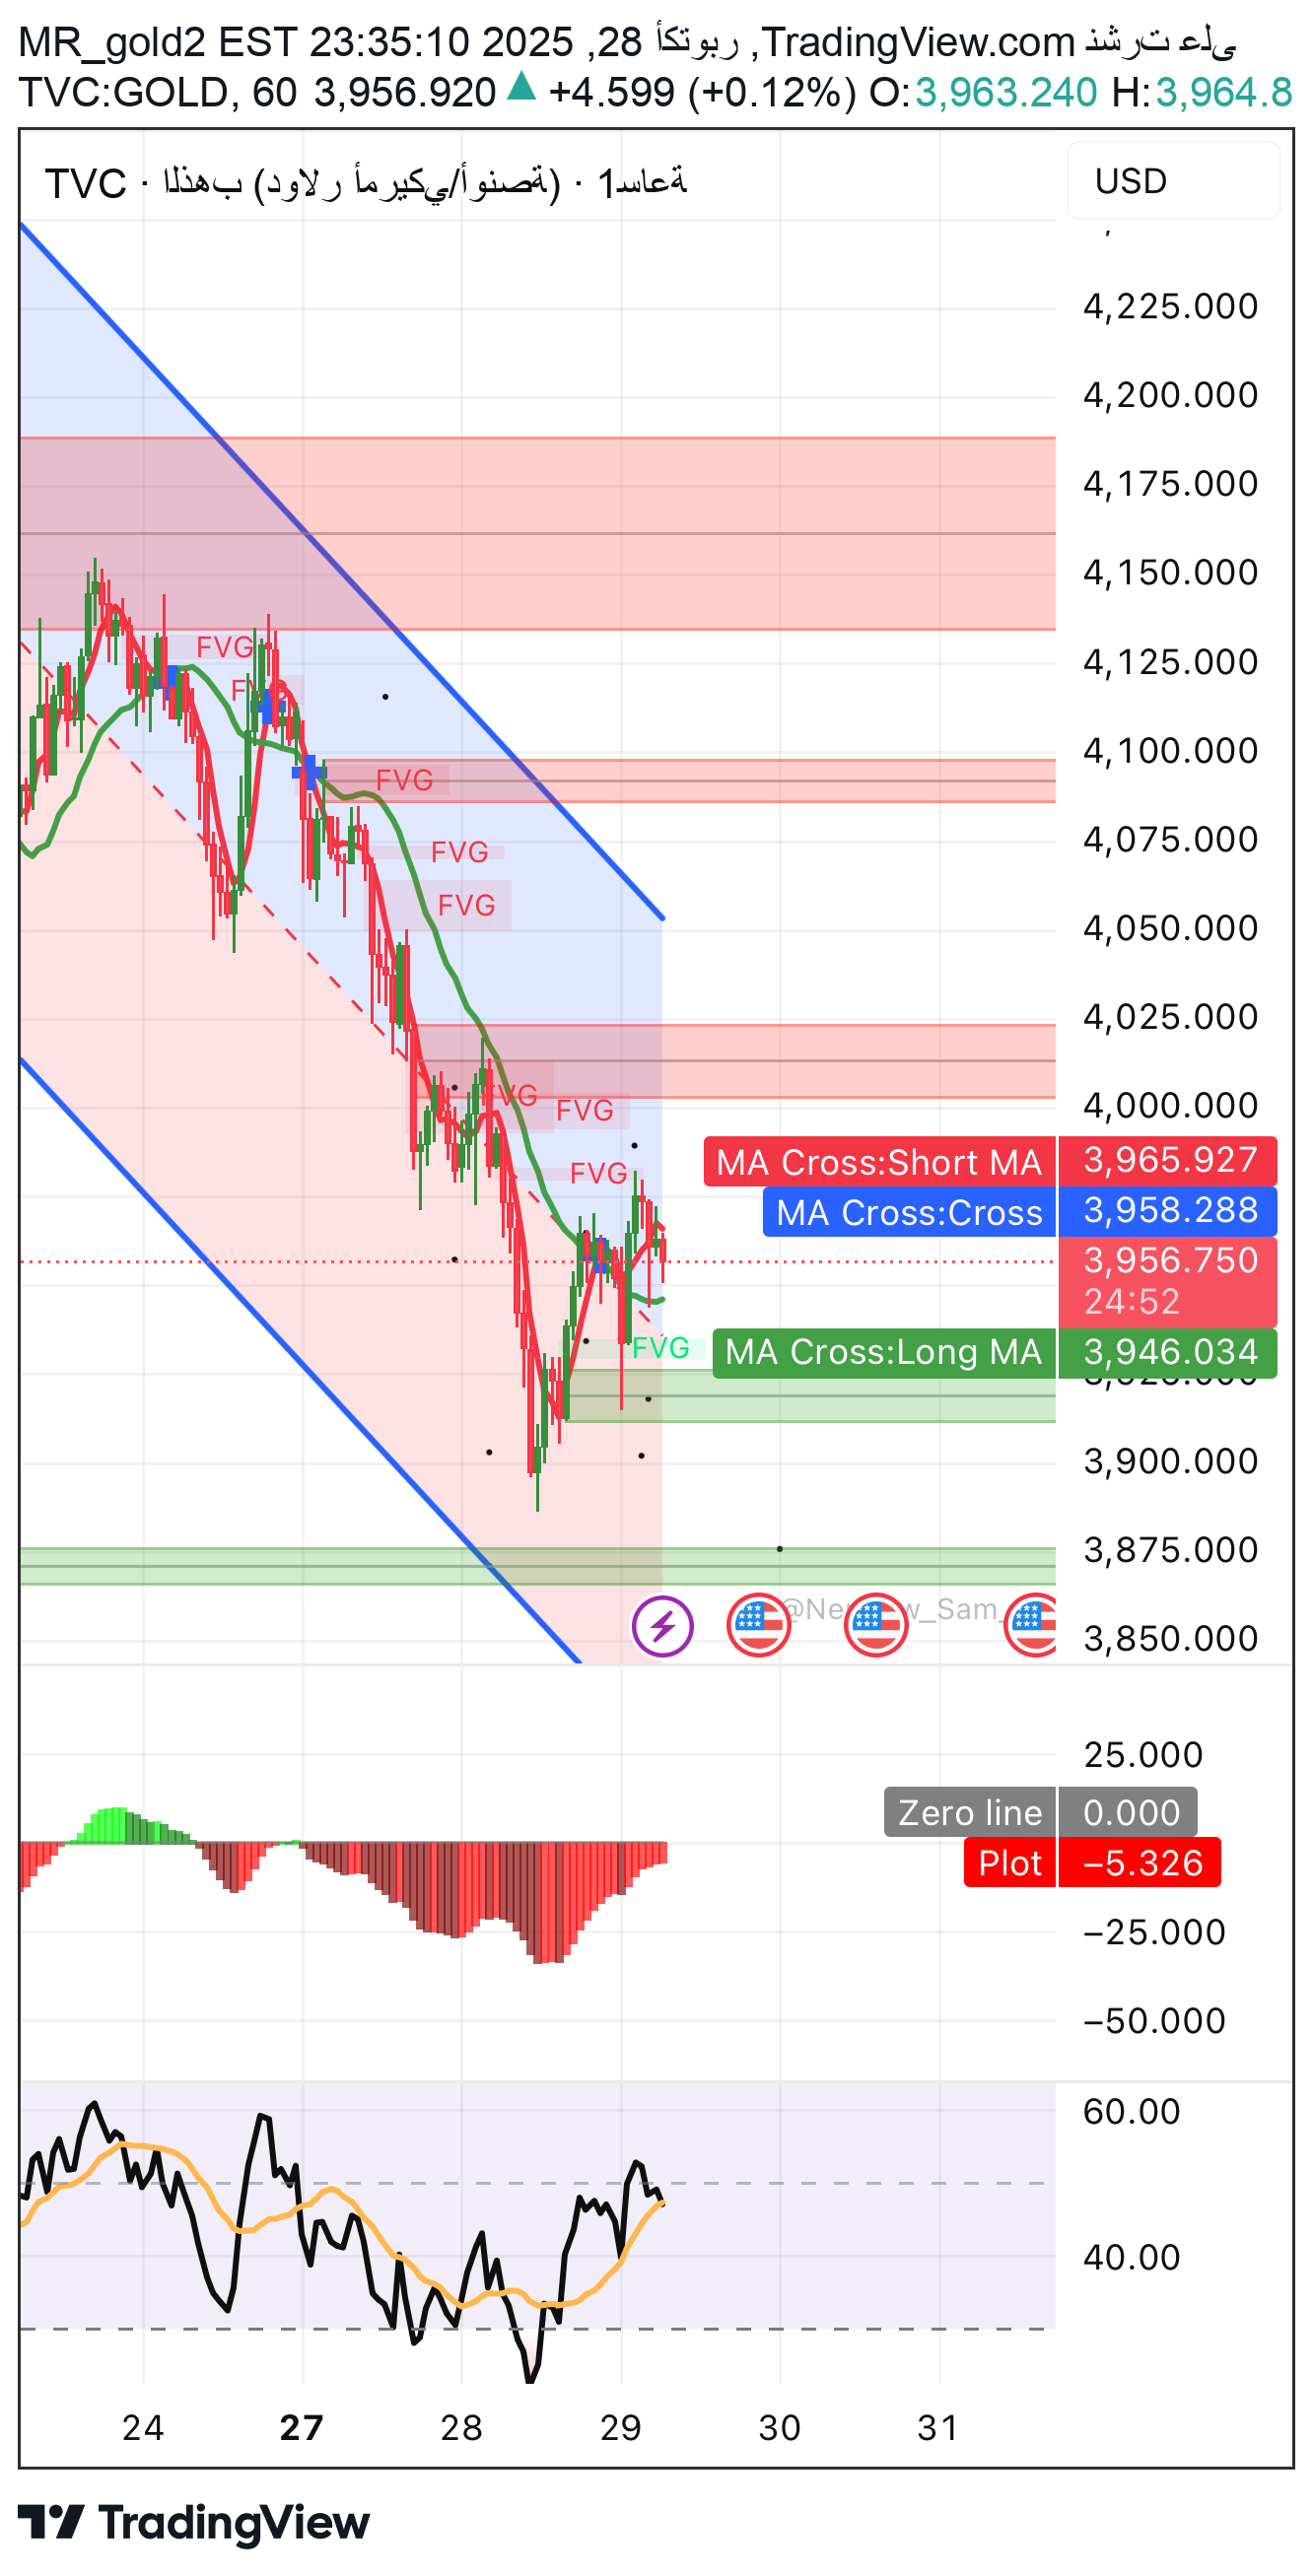
� First: General technical analysis Gold is still moving within a short-term descending channel, but the current technical movement shows signs of a possible rebound from the previous low (3,945–3,950), with the beginning of the formation of a bullish price base within an important demand area. The price is currently facing resistance from the upper border of the descending channel and the red zone at 3,965–3,980, which is a pivotal area to identify the next trend. 📊 Short general trend = bullish correction 📉 Average general trend = still bearish as long as the price is below 4,050 🔹 Second: Wave analysis (Elliott Waves) •The falling wave from 4,300 to 3,940 represents the third major wave (3). •The current movement from 3,940 to 3,960–3,980 is the beginning of the fourth corrective wave (4), before the final bearish fifth wave. •The time target for wave (4) ranges between 4,000–4,050 before the final drop to 3,880–3,850. ⸻ 🔹 Third: Time Analysis (Fibonacci Time Zones) •From the last low at 3,940, the price started a new time cycle. •Currently we are on the third day of the corrective session, which means that the time retracement continues until the end of the New York session or the beginning of the next Asian session. ⏳ The timing supports a short-term bounce towards 4,000-4,050 before selling pressure returns. ⸻ 🔹 Fourth: Digital analysis (Fibonacci Price Levels) 0.236 3,980 First sub-resistance 0.382 4,020 Strong correction resistance 0.5 4,060 Fibonacci axis is important 0.618 4,090 The maximum correction expected before the decline returns 📉 If the price fails to breach 4,020, it will return to falling towards 3,930 � Fifth: Fundamental Analysis •Recent US economic data (Consumer Expenditure Price Index) showed a slight decline in inflation, which temporarily eased pressure on gold. •But statements by Fed officials still indicate a strict monetary policy. •Physical gold demand from Asia remains strong, supporting lows of 3,900. 📊 Fundamental: Limited pressure on gold, with relative stability ahead of the upcoming US employment data (NFP). 🔹 Sixth: Price Action Analysis •Pin Bars from 3,945 confirm the entry of a strong buying order. •A small double bottom formed at 3,950 supports the bullish scenario. •Closing above 3,965 will be a technical signal of a continuation of the rise towards 4,020. 🔹 Seventh: Technical models •The descending channel: The price is still within it, but there is the beginning of a minor breakout upward. •Falling Wedge pattern is being completed — a bullish reversal pattern. •If 3,970 is breached, the pattern is expected to be activated and a short upward wave will begin. 🔹 Eighth: Digital and harmonic models A bullish Bat pattern (bat pattern) is formed: •X = 4,250 •A = 4,050 •B = 4,200 •C = 3,980 •D = 3,940 (perfect reversal point) 🎯 Reflection zone (PRZ): 3,940–3,955 🎯 Objectives of the model: •First goal: 3,985 •Second goal: 4,020 •Third goal: 4,060 🔹 Ninth: Supply and demand areas 🟩Buy Zones: •3,940 – 3,955 → Strong Support Zone (PRZ) •3,880 – 3,860 → Major weekly support 🟥Sell Zones: •4,020 – 4,060 → first corrective zone •4,100 – 4,150 → Strong selling area within the channel 🔹 Tenth: Fixation points and indicators •EMA 50: at 3,965 → short-term resistance. •EMA 200: at 4,080 → medium resistance. •RSI: at 45 and trending upward → beginning of buying momentum. •MACD: Negative but approaching a positive crossover. 🔹 Pivot Zone Current pivot zone = 3,955 – 3,970 •Stability above it = completion of the correction towards 4,020 – 4,060 •A break below it = a return to the decline towards 3,930 🔹 Final Recommendation 🟢 Short-term speculative purchase transaction •Entry area: 3,940 – 3,950 •Goals: 3,985 – 4,020 – 4,060 •Stop loss: hourly close below 3,930 •Return to risk ratio: 1: 2.5 📉 Alternative scenario: A clear break below 3,930 → We wait for a retest of 3930 and its transformation into selling resistance for the resumption of the fifth wave towards 3,860–3,830 Important note We do not provide you with financial and investment advice Rather, we provide you with scientific and educational content You are the only person responsible for pressing the buy and sell button Analyst Engineer Ihab Sayed Al Thahab channel