Technical analysis by SatochiTrader about Symbol BTC: Sell recommendation (10/28/2025)

SatochiTrader
بیت کوین سقوط کرد: آیا روزهای قرمز در راه است؟ (تحلیل قیمت و حمایتهای کلیدی)

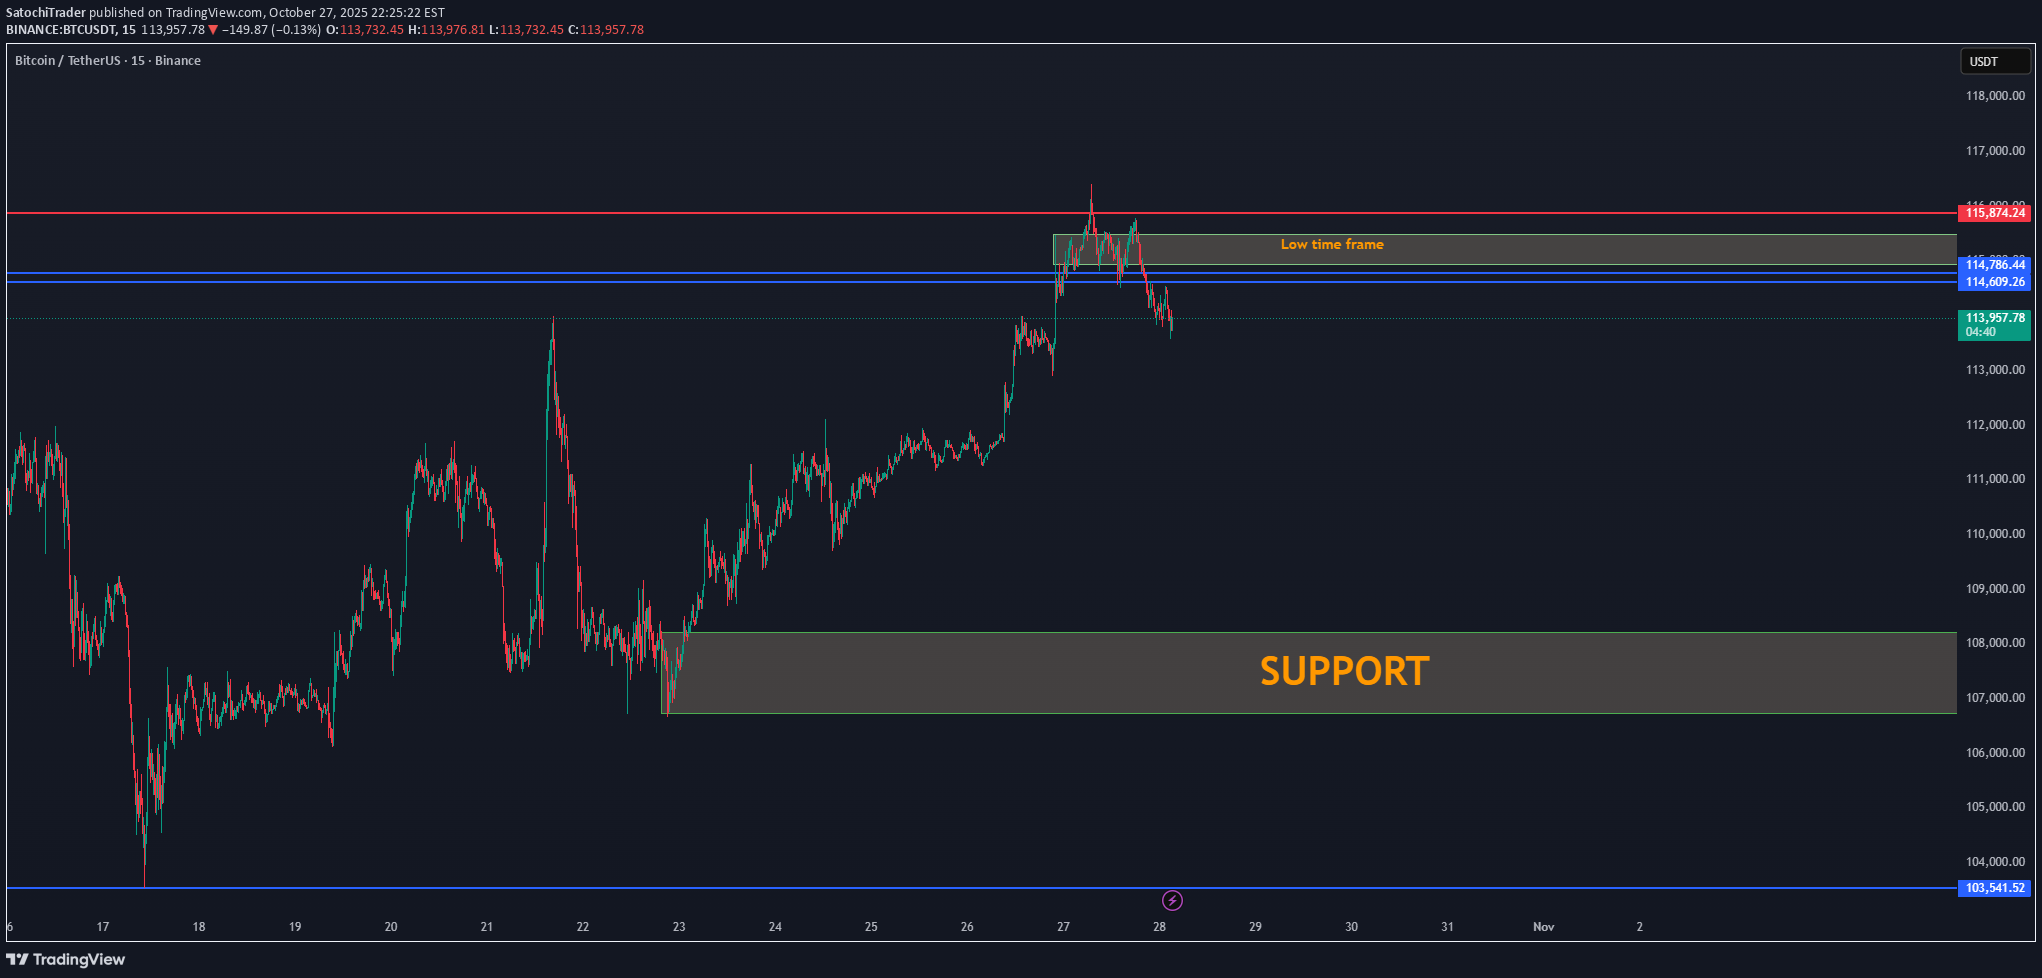
Bitcoin has lost the low time frame structure around the $114.6K – $114.8K zone, signaling a possible shift in short-term momentum. The break below this area indicates weakness, and BTC is now testing the mid-range levels while showing signs of slowing volume. 📉 Short-term view: Momentum has turned bearish after rejection from $115.8K. Next support zone sits around $108K – $109K, where buyers may try to step in. If this level fails to hold, BTC could revisit $103K support — the key demand area from the previous range. 📊 Technical observation: BTC’s structure shows a completed short-term top followed by a lower high formation. This setup often confirms a local downtrend and can lead to several red candles before a new base forms. 💬 Summary: Bitcoin lost its low time frame momentum, and we could be entering a red session. We’ll monitor how price reacts near the $108K support zone to evaluate if buyers can regain control or if a deeper correction begins. We follow the data, at this moment the marketview seems to be red, we will follow if this continues in the coming hours.at this moment, depending on this data, still a good chance BTC can return below 110KFollowing the upcoming time framesTA reason of the previous trend that broke downBitcoin can range between 113700 and even 115700, but the chance is high it can fall below 110K in the coming time frames.US30 can also affect BTC price action.At the previous BTC crash, we did expect the breakdown trend. not how far the crash would be going, but at last that the trend is not healthy and shows a breakdown follow.The volume we see today is a manipulated volume. time will learn why; this can even crash BTC We will follow BTC further for the confirmation of the red trend. We will make a study between this volume and the volume that took BTC before 101K