Technical analysis by MR_gold2 about Symbol PAXG on 10/28/2025

MR_gold2
پیشبینی طلا: آیا کف قیمتی همینجاست یا سقوط به ۳۸۵۰ ادامه دارد؟
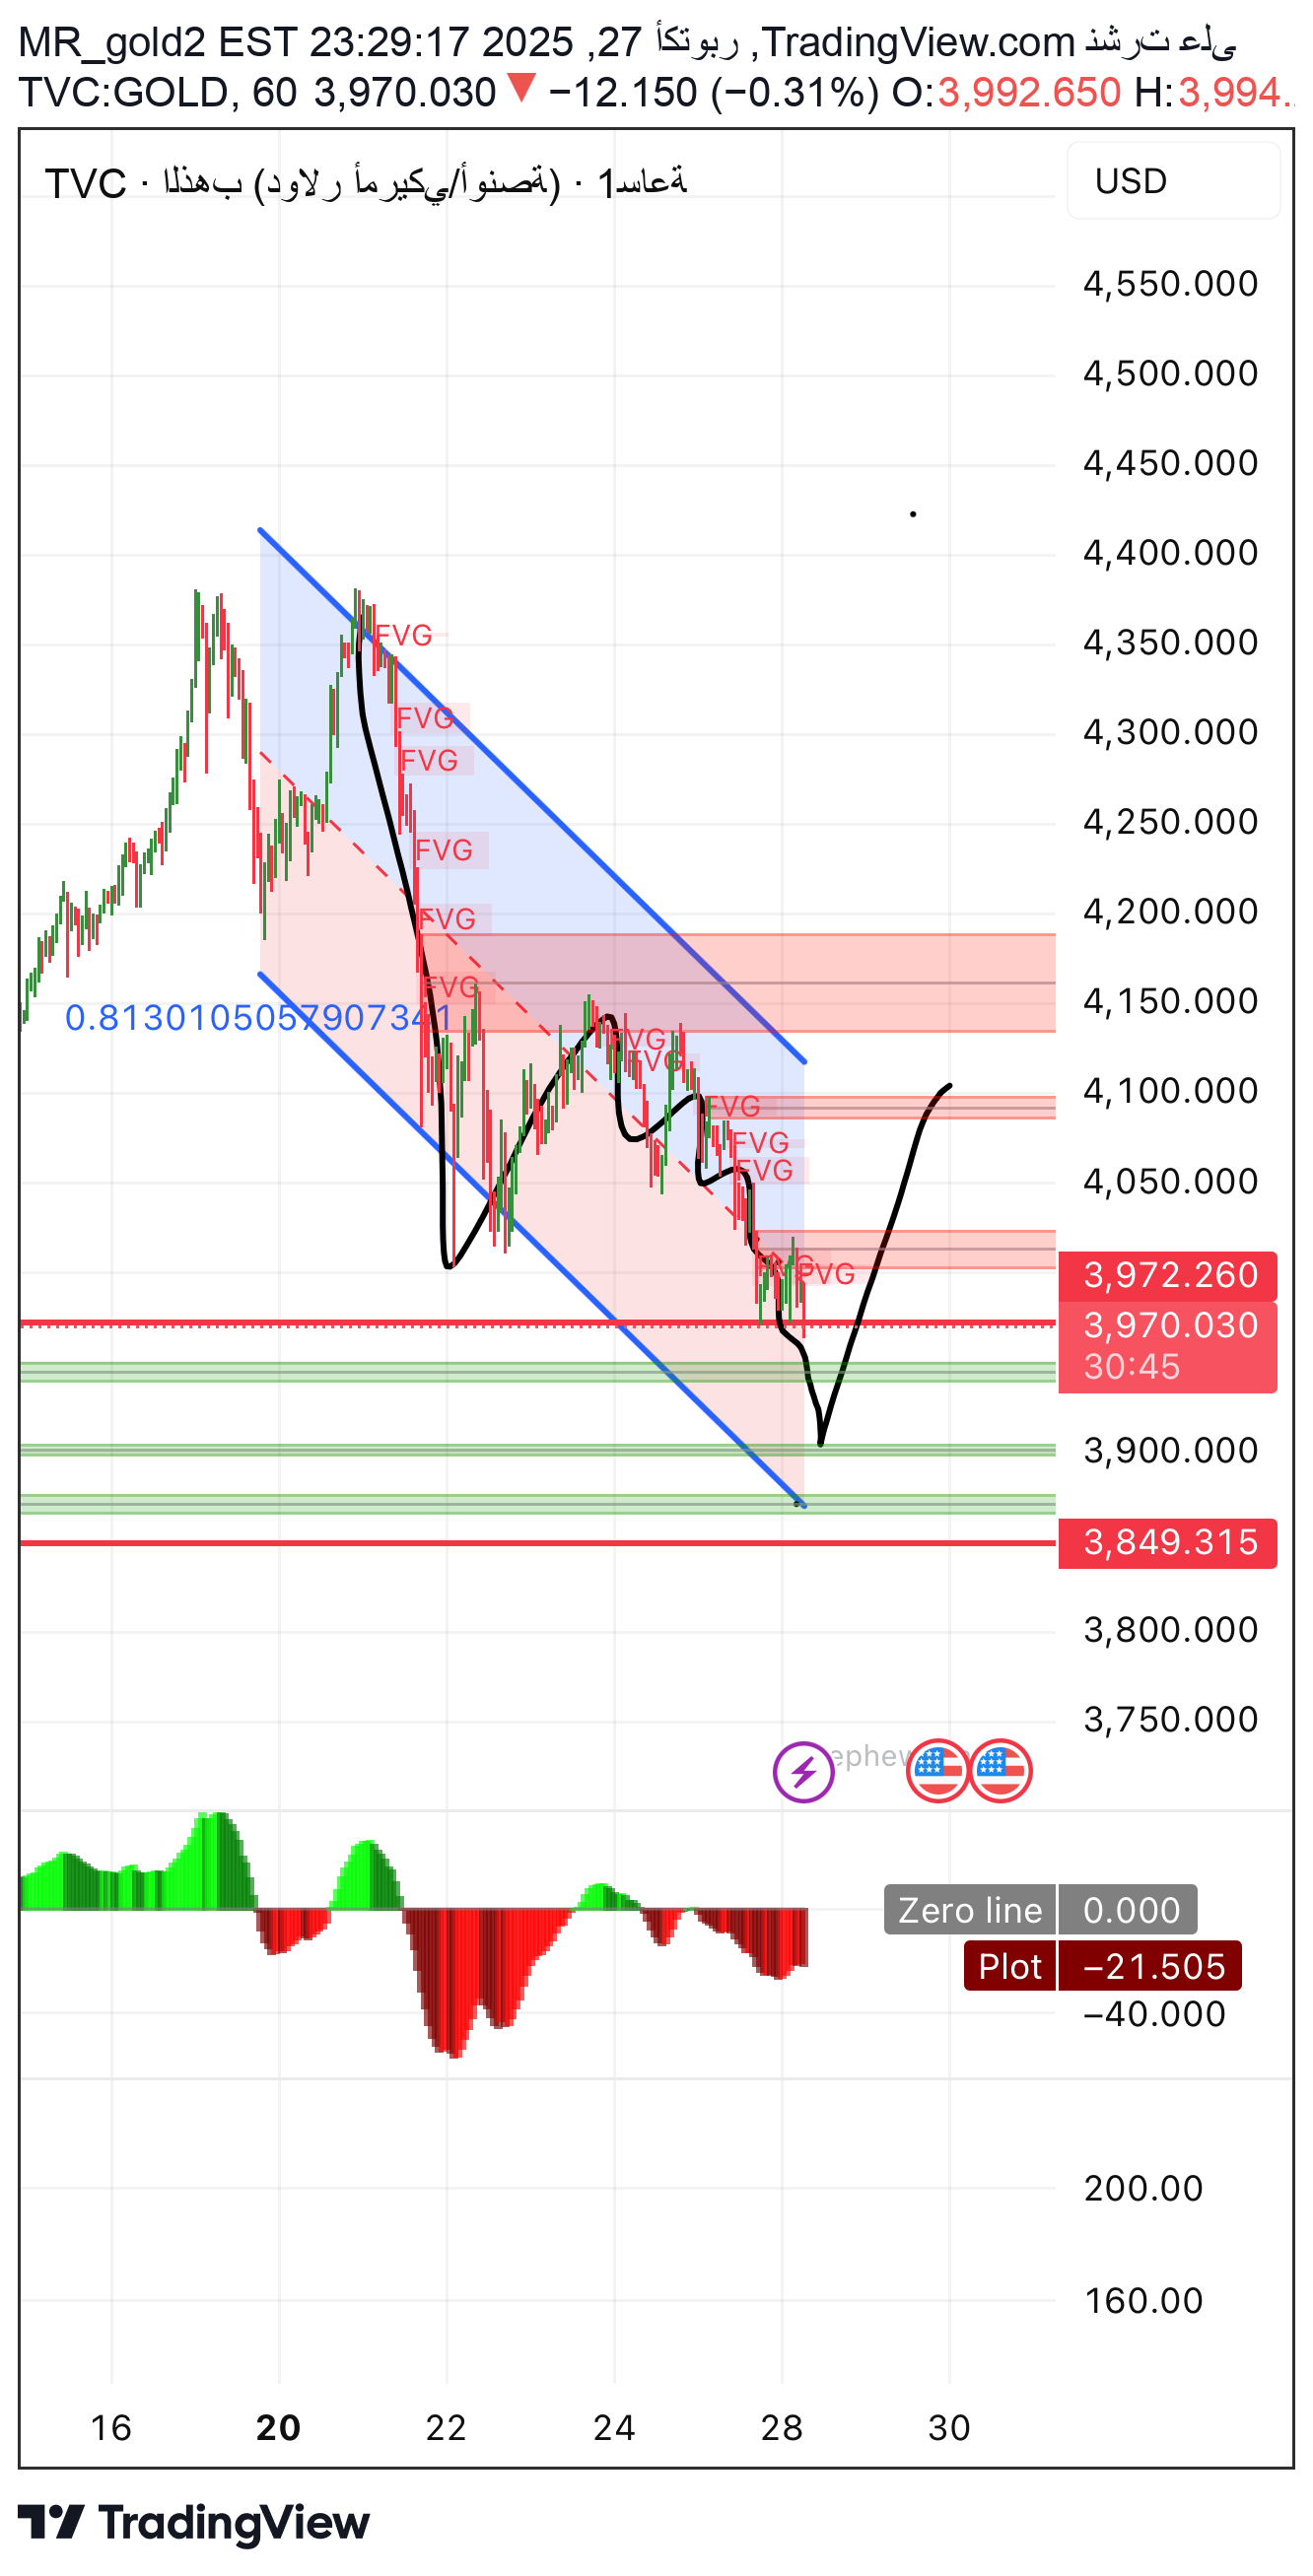
First: General technical analysis Gold on the hourly frame is within a clear bearish channel, the price is now approximately at the lower border near 3,983 – 3,972, which is a strong support area previously formed from a combination of orders + previous bounces + a partially closed FVG level. The price structure is still a bearish correction within a subtrend, and a strong reversal candle has not yet appeared to confirm the bottom. 🔹 Second: Elliott Wave Analysis The current structure shows a possible completion of a C or Y wave within a WXY composite correction, where: •Wave W ended at approximately 4,420 •Wave X at 4,280 •Wave Y is currently extending near 3,970 – 3,950 📈 If the 3,970 level is broken with an hour candle and closes below → a possible extension of the Z wave towards 3,850. 📈 As for stability and rebound from 3,970 → the beginning of a new corrective upward wave (A-B-C) towards 4,080 then 4,160. 🔹 Third: Fibonacci Time & Cycles Based on the consistency of time waves: •There is a critical time zone between October 29 and 30 (an expected time bottom). •Then a short-term bull cycle is likely to begin (perhaps until the next FOMC session). 🔹 Fourth: Digital analysis Sensitive area numbers: 3,972 Major support Possible bottom for a time correction 3,949 Minor support/Fibo point 78.6% If 3,972 is broken 3,849 Very strong support (Weekly Pivot Point) 4,080 First resistance 4,165 Second resistance (FVG area not closed) 4,250 Axial resistance inside the channel Fifth: Fundamental analysis •Gold is currently affected by anticipation of US inflation data and Federal Reserve decisions. •Continued interest rate cut expectations in December support gold in the medium term. •But in the short term, the technical strength of the dollar is putting pressure on the price. 🔹 Sixth: Price Action •Current candles have weak momentum, but show bearish rejection below 3,972. •The next hour candle is very crucial: 🔸 Close above 3,990 = reversal signal. 🔸 Close below 3,970 = completion of correction to 3,850. 🔹 Seventh: Supports and resistances Supports: 3,972 – 3,949 – 3,849 Resistors: 4,080 – 4,165 – 4,250 🔹 Eighth: Technical models A falling wedge pattern may be forming inside the descending channel. Breaking its upper border will be a strong bullish signal towards 4,160 then 4,250. 🔹 Ninth: Harmonic models Probability of Bullish Bat pattern: •X at 4,420 •A at 4,080 •B at 4,250 •D expected at 3,850 → strong demand zone. 🔹 Tenth: Supply and demand zones •Demand area: 3,970 – 3,850 •Display area: 4,160 – 4,250 🔹 Eleventh: Fixation points and axial area Pivot point: 3,972 •Continuity above it enhances the chances of returning to 4,080 •Breaking it with an hour candle confirms the extension of the decline. 🔹 Recommendation (according to comprehensive analysis) 🎯 First scenario (looking for buying opportunities from the area 3,970 – 3,950) But be careful because it is now in a downward trend Stop loss: 3,835 First goal: 4,080 Second goal: 4,160 🎯 Alternative scenario (if 3,970 is broken strongly) Waiting for a retest of 3,970 as resistance, then selling towards 3,850 –