Technical analysis by readCrypto about Symbol ETH on 10/27/2025

readCrypto
آیا قیمت اتریوم از 4403.87 عبور میکند؟ نقشه راه صعودی و نکات حیاتی ترید!
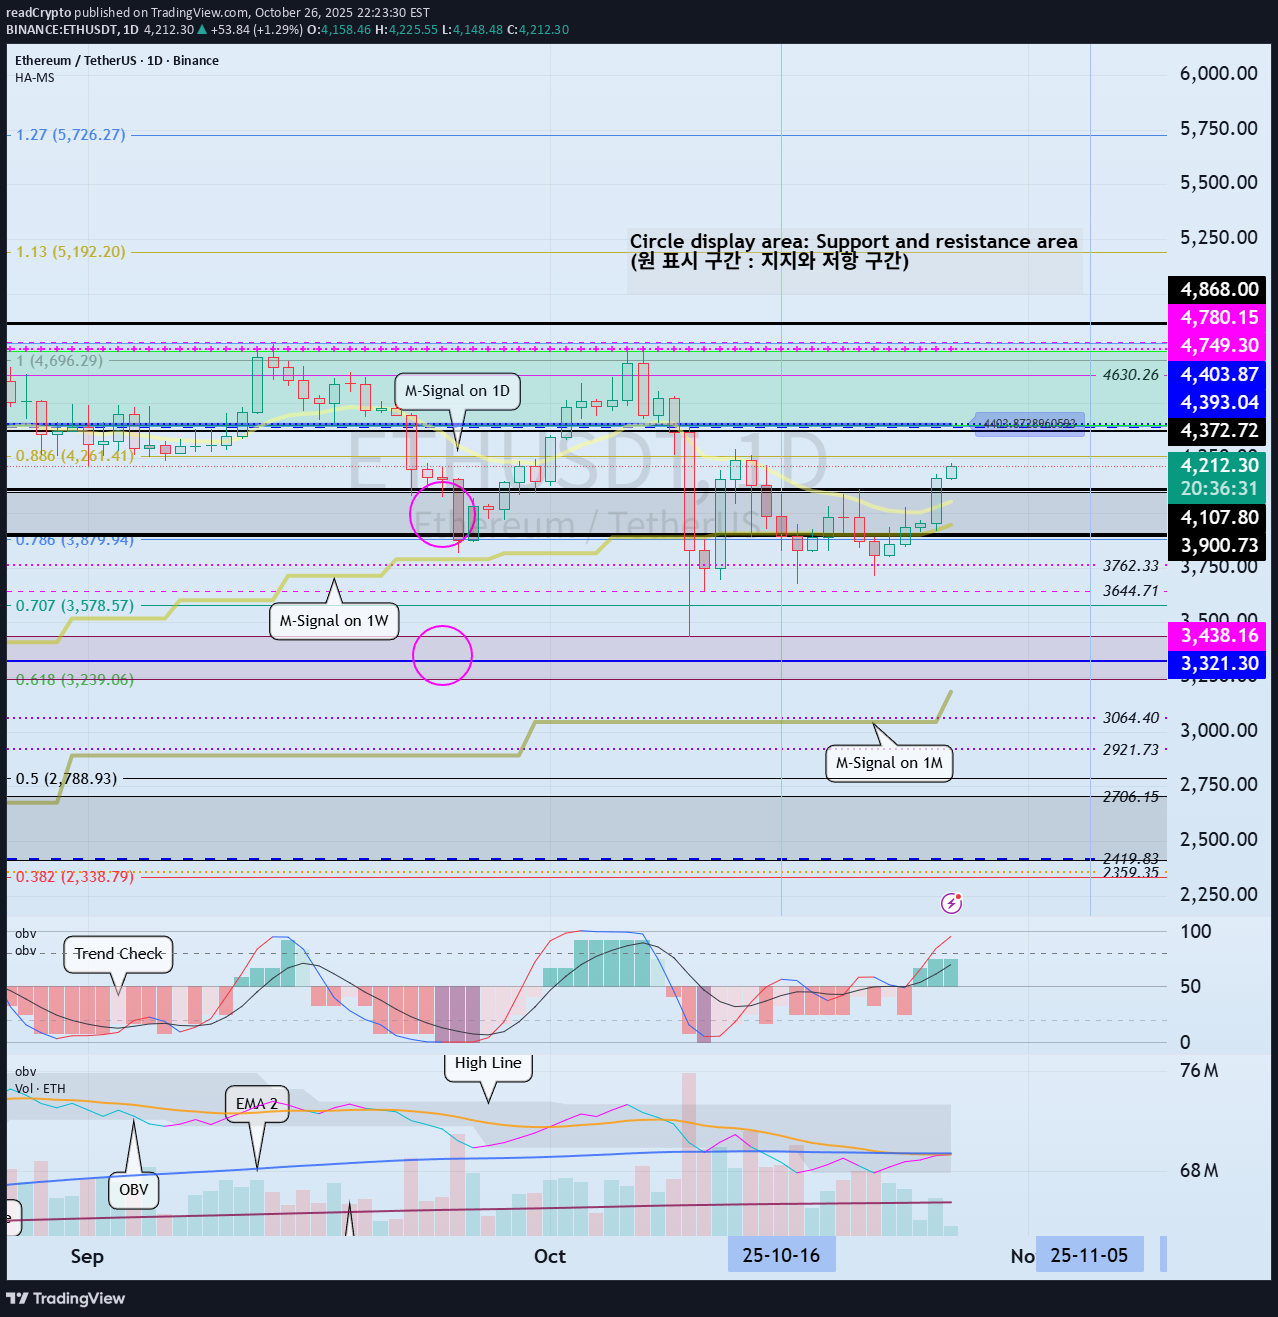
Hello, traders. Follow us to get the latest information quickly. Have a great day. ------------------------------------- (ETHUSDT 1W chart) The formation of an upward trend line (A) created an upward channel from (A) to (B). Therefore, the key is whether it can continue to rise along this upward trend line. If the upward movement fails, we need to check whether the price rises along the rising trend lines (1) and (2). Therefore, the 3900.73-4107.80 range is a crucial area for sustaining the upward trend. In this context, we expect a significant period of volatility to begin around the week of November 24th. This period of volatility could continue until around the week of January 12th, 2026. - (1M Chart) If this month closes with a bearish candle, forming an upward trend line (a), the key question is whether the price can rise along trend line (a). If not, there's a possibility of touching the upward trend line (2), so we need to consider a response plan. - (1D Chart) The key is whether the price can sustain above the uptrend line (1) and rise above 4403.87. To do this, we need to see if it can break above the downward channel created on the 1D chart. Therefore, we need to observe how the price moves after the volatility period around November 5th. The HA-High ~ DOM(60) section (4393.04-4780.15) on the 1W chart overlaps with the HA-High ~ DOM(60) section (4403.87-4749.30) on the 1D chart, so it's likely to act as resistance. ------------------------------------ The basic trading strategy is to buy in the DOM(-60) ~ HA-Low section and sell in the HA-High ~ DOM(60) section. However, if the price rises from the HA-High to DOM(60) range, a step-like uptrend is likely, while if it falls from the DOM(-60) to HA-Low range, a step-like downtrend is likely. Therefore, a split trading strategy is recommended. To maintain a step-like uptrend in the DOM(-60) to HA-Low range, 1. The StochRSI indicator must be rising. If possible, it should not enter the overbought zone. 2. The On-By-Value (OBV) indicator must be rising. If possible, it should remain above the High Line. 3. The TC (Trend Check) indicator must be rising. If possible, it should remain above the 0 level. If the above conditions are met, the uptrend is likely to continue. If not, a high point is likely to form, so you should consider a countermeasure. - Thank you for reading to the end. I wish you successful trading. --------------------------------------------------