Technical analysis by MR_gold2 about Symbol ETH on 10/26/2025

MR_gold2
تحلیل تکنیکال اتریوم: آمادهسازی برای ریزش بزرگ یا اوج جدید؟
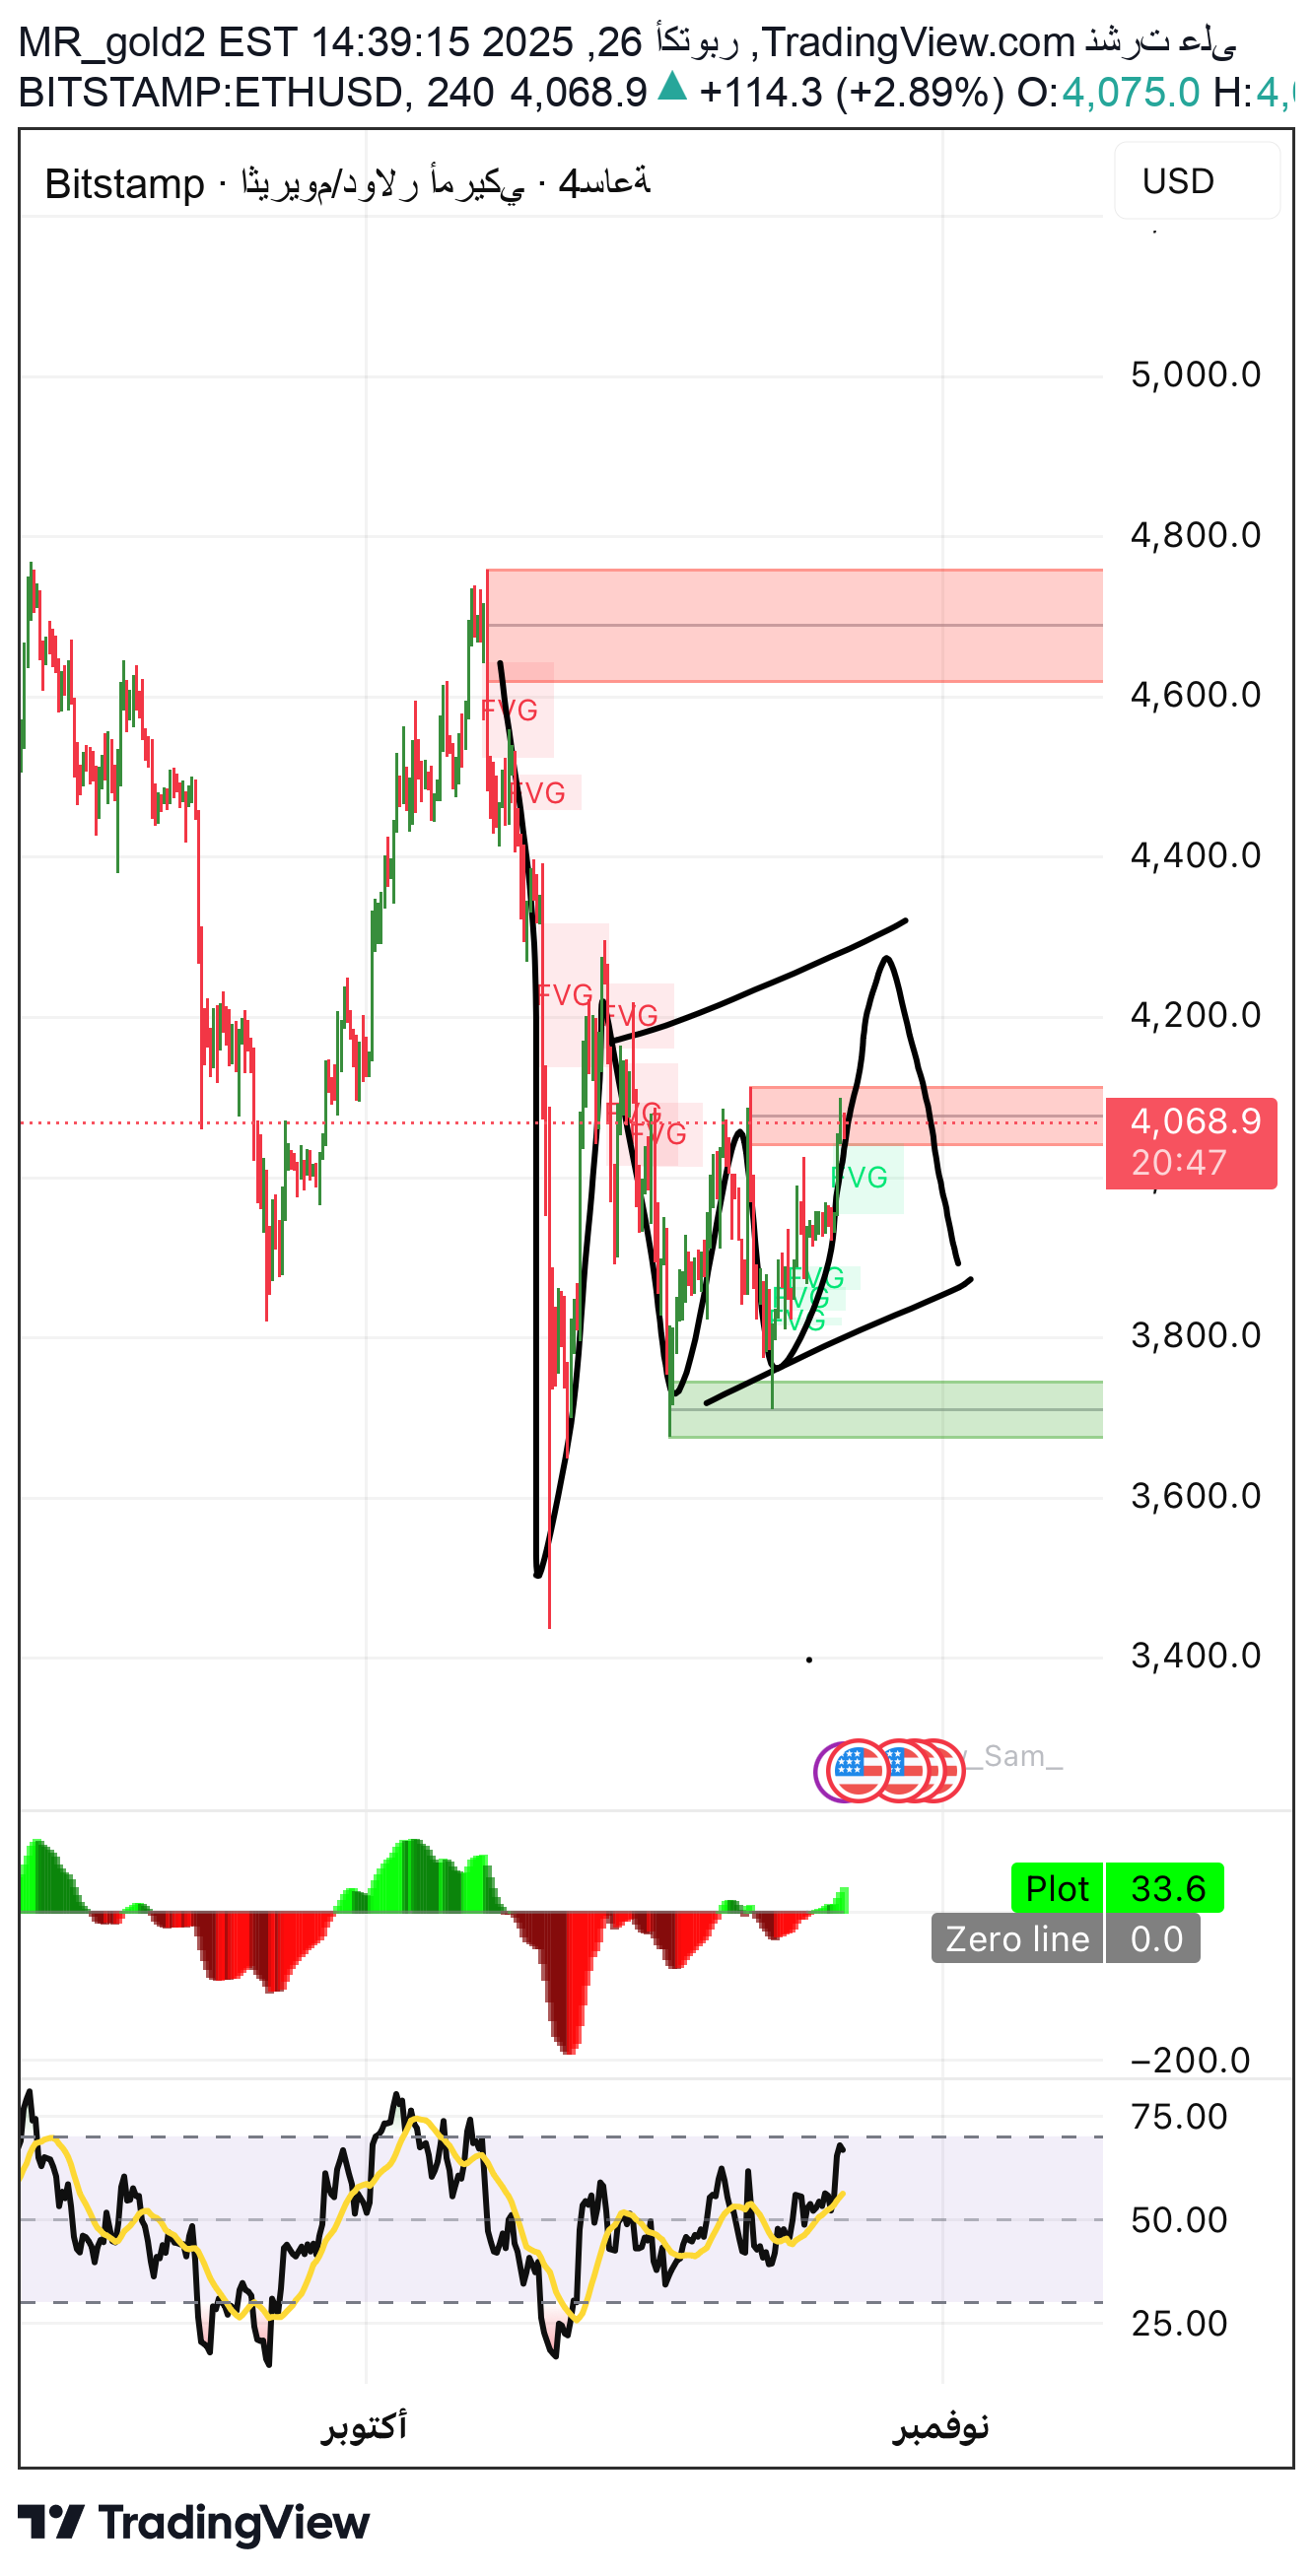
� General technical analysis: Ethereum is moving in a bullish sideways corrective range after the sharp decline from the 4,600 to 3,600 area. The intermediate trend is still corrective bearish, while the current movement indicates an attempt to build a new price base in preparation for an upcoming wave. The current price of $4,067 is approaching a sub-resistance area, after a clear bounce from the bottom 3,700 – 3,750. 🔸 Wave analysis (Elliott Waves): •The previous drop from 4,600 to 3,600 represents a major (1) impulse wave. •The current movement is most likely a sub-corrective wave (2) within an ABC pattern: ◦Wave A: from 3,600 to 4,050 ◦Wave B: Sub-correction to 3,800 ◦Wave C: It currently extends towards 4,150 – 4,200 before the correction is completed. • Once the price reaches around 4,200, a new third (3) downward wave is expected to start, targeting 3,600 – 3,500. 🔸 Fibonacci Time Cycles: •The previous bearish wave lasted about 12 candles, 4 hours. •The current corrective cycle has exceeded 9 candles, which indicates that a trend reversal may be approaching within the next two days in the event of price rejection at 4,150. 🔸 Digital analysis (Fibonacci Levels): Major resistance 1 4,150 – 4,200 Fibonacci retracement level 0.618 for the downward wave Major resistance 2 4,350 – 4,400 Previous strong selling area Main support 1 3,750 Previous retracement bottom Main support 2 3,600 End of the first wave Pivotal point 4,000 Current price equilibrium ⸻ 🔸 Fundamental analysis: •Ethereum benefited from the general rise in the digital currency market after expectations of a US interest rate hike declined. •But institutional trading volume is still weak compared to Bitcoin, which could make the current move just a temporary bounce. •Developments in the spot Ethereum ETF could provide strong support if approved in the coming weeks. ⸻ 🔸 Price Action: •Bullish candles with medium momentum, but with upper shadows → gradual price rejection signals at each rise towards 4,100. •If a strong rejection candle appears at 4,150 (such as Pin Bar or Engulfing), a bearish reversal signal will be confirmed. ⸻ 🔸 Technical models: •A small “double bottom” pattern between 3,700 and 3,800 completed and broke up, targeting 4,150. •At the same time, a corrective upward channel pattern has formed within a general downward trend → indicating the possibility of a downward breakout later. ⸻ 🔸Digital and harmonic models: There is a possibility of a Harmonic Bearish Gartley pattern forming as follows: •X = 4,600 •A = 3,600 •B = 4,050 (61.8%) •C = 3,800 (38.2%) •D = 4,180 – 4,200 (PRZ potential reversal zone) 🟥 Potential Reversal Zone (PRZ): 4,150 – 4,200 🟩 First goal: 3,800 🟩 Second goal: 3,600 ⸻ 🔸 Supply and demand zones: •🟥Sell Zones: •4,150 – 4,200 (potential reversal area) •4,350 – 4,400 (the strongest area of the major wave) •🟩Buy Zones: •3,750 – 3,800 •3,600 – 3,500 ⸻ 🔸 Fixation points and indicators: •EMA 50 at 4,030 → temporary dynamic support. •EMA 200 at 4,250 → strong resistance. •RSI is at 56 and heading towards overbought. •MACD shows slowing in bullish momentum → near reversal. ⸻ 🔸 Axial area: •The area between 4,000 – 4,050 is the actual price axis; Any close above it is temporarily bullish, and below it is negative. ⸻ 🔸 Final recommendation: 🔻 Potential sale deal (Sell setup): 🎯 Entry area: 4,150 – 4,200 🎯 Goals: 3,850 – 3,700 – 3,600 ⛔️ Stop loss: 4-hour close above 4,250 ⏳ Expected time period: 2 to 3 trading days 🟢 Alternative scenario: In the event of a strong breach and close above 4,250 → the price will head towards 4,400 – 4,450 to complete the major corrective wave before falling Important note We do not provide you with financial and investment advice Rather, we provide you with scientific and educational content You are the only person responsible for pressing the buy and sell button analyst Engineer Ihab Sayed Al Thahab channel