Technical analysis by Nabi_Gunduz about Symbol PAXG on 10/26/2025

تحلیل اونس طلا (26.10.2025): سیگنالهای معاملاتی و سناریوهای احتمالی هفته پیش رو
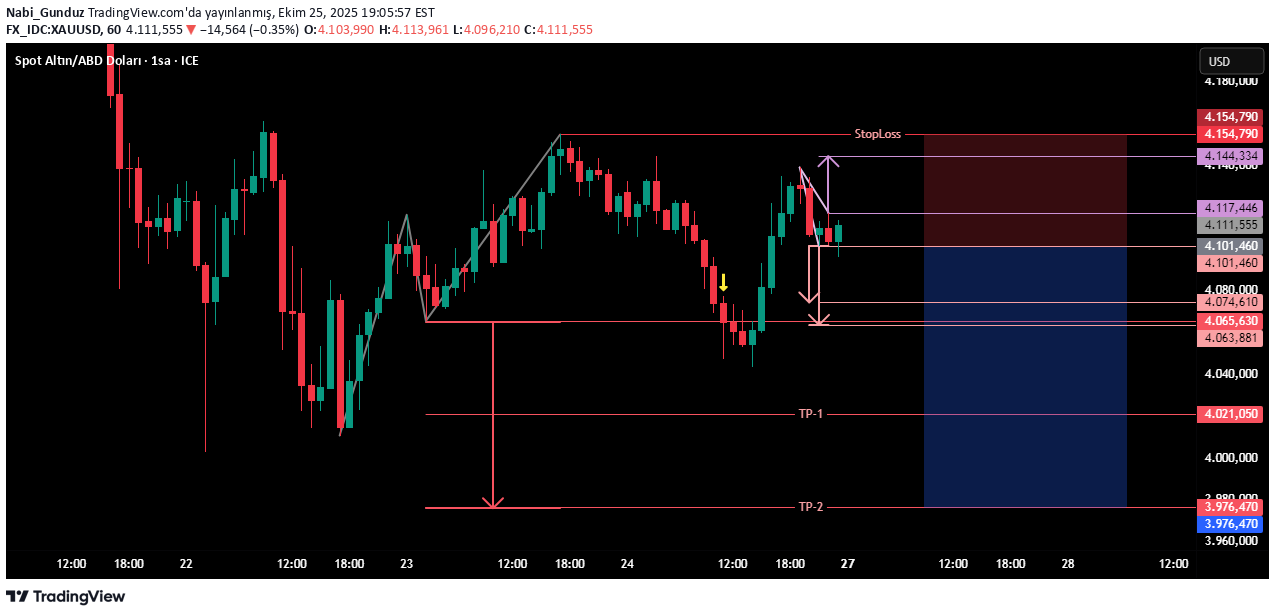
Hello, In my analysis this weekend, I want to start with small time frames, which I have not done much before. However, it should not be forgotten that formations formed in time periods such as half an hour or 1 hour are not very reliable. Our main chart is on the 1 hour time frame. The formation you see with the gray zigzag on the chart is a formation known as 123. The formation, which produced a sell signal with a 1-hour candle closing below 4065.630, seen in light red, returned before reaching its targets as a result of the price rising due to the US CPI data announced on Friday being lower than expected, but since the stop level of the formation is 4154.790 and the price is still below the stop level, there is still a possibility that it can turn around and reach its targets. On the same chart, there are 2 more formations formed in the 30-minute period, seen in lilac color and pink color. A 30-minute candle closing above 4117.446 may cause the price to go to 4147.334, while a 30-minute candle closing below 4101.460 may cause the price to go to 4074 and 4063. If the last downward wave, which made a downward market break on this 4-hour chart, has completed its decline, there will be a possibility of an Optmal Trade Enytry (OTE) formation with an upward break of the 4-hour FVG region seen in pink color on the chart. In such a case, the possibility that the price may rise to the yellow range on the chart and face sales from this region can be evaluated. In this chart, which is also on the 4-hour time period, a reverse pennant formation is seen when the internal wave structures are taken into account. In order for the formation to generate a signal, it is necessary to see a 4-hour candle closing below 4011. In the chart formations in another 4-hour period, there are formations that produced signals in both directions. If you pay attention, whenever such double-sided signals occur, we see that the price makes unbalanced movements. This would be a harbinger of possible consolidation... In this 4-hour chart, you see the FVG regions in different time periods. After the neckline of the double top formation was broken downwards, we see that the price fell to the upper level of the weekly FVG region and received a reaction from this region. Therefore, this region needs to be monitored carefully to ensure the continuation of the decline. I did not indicate it in the charts, but after the market breakout, the consolidated price consolidated between last week's weekly L3 and L4 levels. Let me mention this as a footnote... The most important areas to pay attention to in this daily chart are the pink FVG region and the green IFVG region. Since the downward break of the green zone means the downward break of the last uptrend FVG zone, the zone turned into IFVG and acted as a resistance zone. The price may test this area and decline again. In order for the price to rise again, it must close a daily candle above this region. Not only this, but also a daily candle close above the pink zone, which is the last decline FVG, is required for the rise... Finally, as can be seen in this weekly chart, in order for those who invest in physical gold to predict where the price may go in the long term, there will be a possibility that the price may go up to 5450 after weekly candle closings begin to occur above the peak. But it's too early to talk about these... Daily PIVOT for Monday: 4099.92 Weekly PIVOT for next week: 4165.81 HAPPY SUNDAY...