Technical analysis by Mentor_Michael03 about Symbol BTC: Buy recommendation (10/25/2025)

Mentor_Michael03
رازهای موفقیت در ترید: با این ۵ اشتباه فنی و روانی، چرخه شکست را بشکنید!
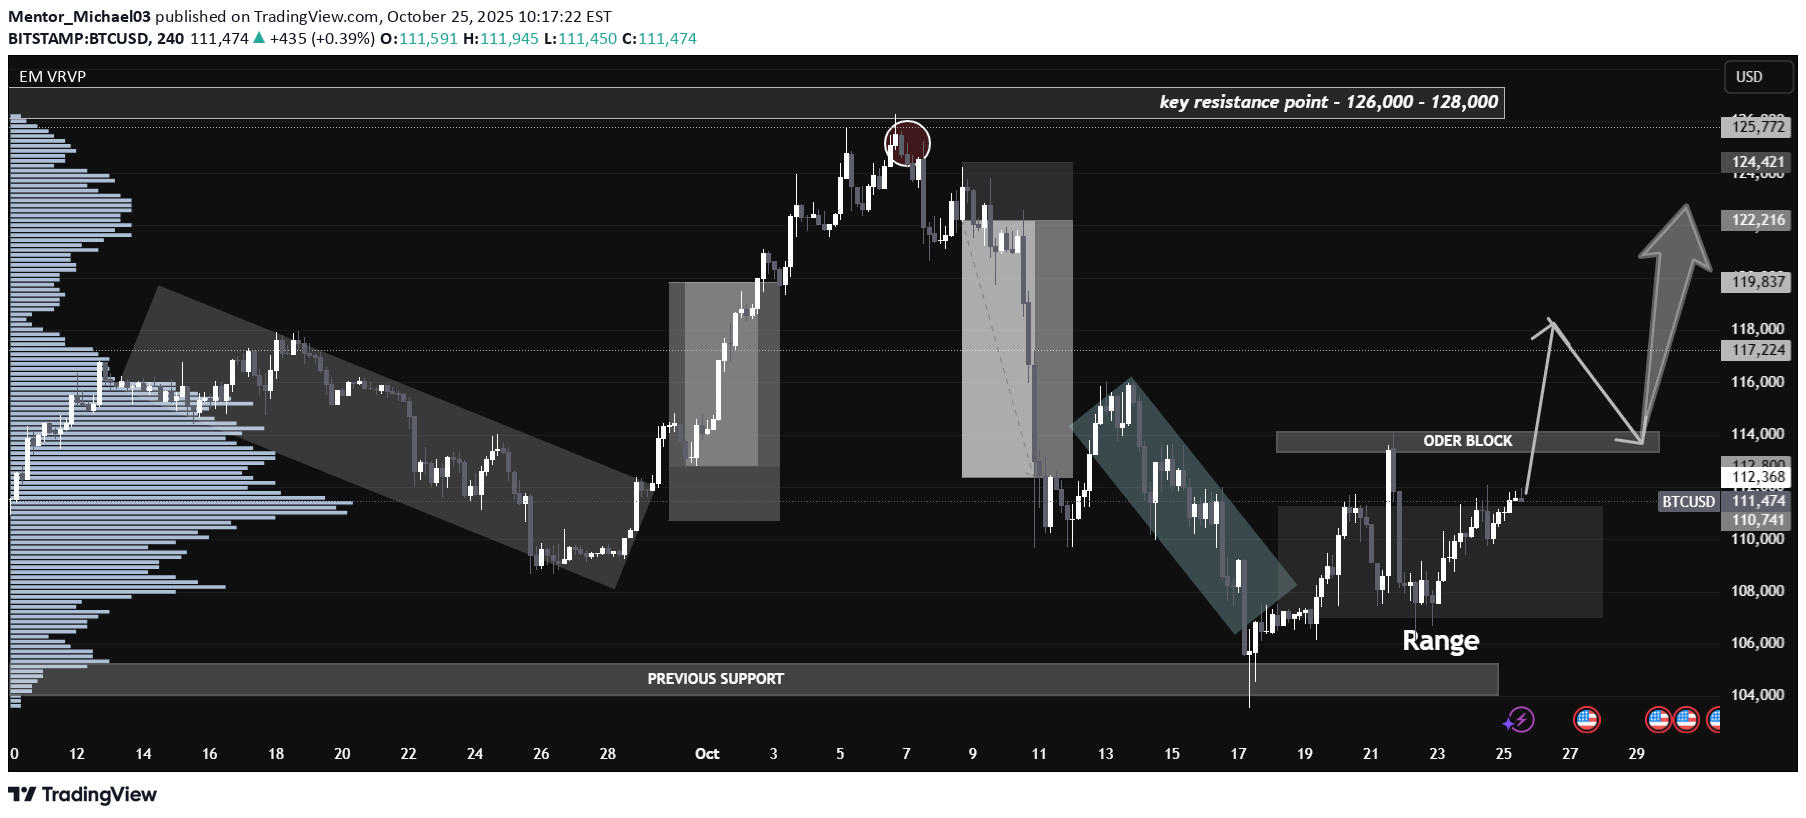
Hello guys, technical structures, psychological mistakes, and must-know trading lessons from the chart you provided. 1. Key Resistance and Institutional Supply Zone The chart clearly shows a major resistance area between 126,000 and 128,000. Notice how the market reached this zone, tried to break through, but was sharply rejected. This behavior signals strong institutional selling and the presence of large limit orders. If you don’t recognize zones like this—and continue to buy blindly into them—you’ll consistently get trapped on the wrong side of the move. This is a crucial fix many traders ignore: always identify and respect multi-test resistance levels before committing to new entries. 2. Order Block and Price Memory The order block around 114,000 highlights where previous bullish momentum paused and strong sellers stepped in. As BTCUSD retraces and tests this block, you should pay close attention to whether price holds and shows bullish rejection (wicks, volume increase, engulfing candles) or slices through, which would signal deeper weakness. Failing to react when price interacts with such key supply/demand zones is a classic trader mistake—fix this by treating these blocks as battle areas, not just lines on a chart. 3. Accumulation Range and Market Psychology The market spent several sessions consolidating between 106,000 and 112,000, forming a range. Ranges are difficult: they trap impatient traders expecting a quick breakout. The “range” annotation on your chart is vital—before you’re a successful trader, you must master range trading: wait for confirmed breakouts or play the edges, not the middle. Remember, breakout traders often lose money by chasing momentum into exhaustion, while smart money accumulates quietly and then drives price. 4. Bullish Breakout and Roadmap Recently, price has broken out above the range and is testing the order block near 114,000. If bulls can continue to defend this area, the roadmap becomes: A retest and hold of the order block Move towards 117,000 and 119,000 short term If bullish momentum sustains, a run at 122,000 and challenge of the key resistance at 126,000 But if the order block fails, expect retracement back to the range lows—mark your invalidation levels and don’t get caught in hope trading. 5. Trading Psychology & “Fixing” the Issue Every part of this chart secretly teaches discipline. If you want to be successful, you must fix: Entering impulsively without recognizing supply/demand battle zones Ignoring support/resistance history Not setting stop-losses just outside invalidation zones Holding losing trades hoping for reversals, instead of reacting to market evidence 6. Risk Management: The True Edge Always use prudent position sizing, set logical stop-loss orders (for example, just below the order block or under range lows for bullish setups), and take partial profits at predetermined resistance steps. Risk only what you’re prepared to lose. Summary & Final Thought: This BTCUSD chart is a mirror for traders: every time you fail to fix technical discipline—disregarding resistance, not respecting order blocks, ignoring ranges—you undermine your edge. But once you “fix this,” acting on price structure, dynamic levels, and risk, you lay the foundation for real success. Until you fix this, you’ll never be a successful trader. Start today.