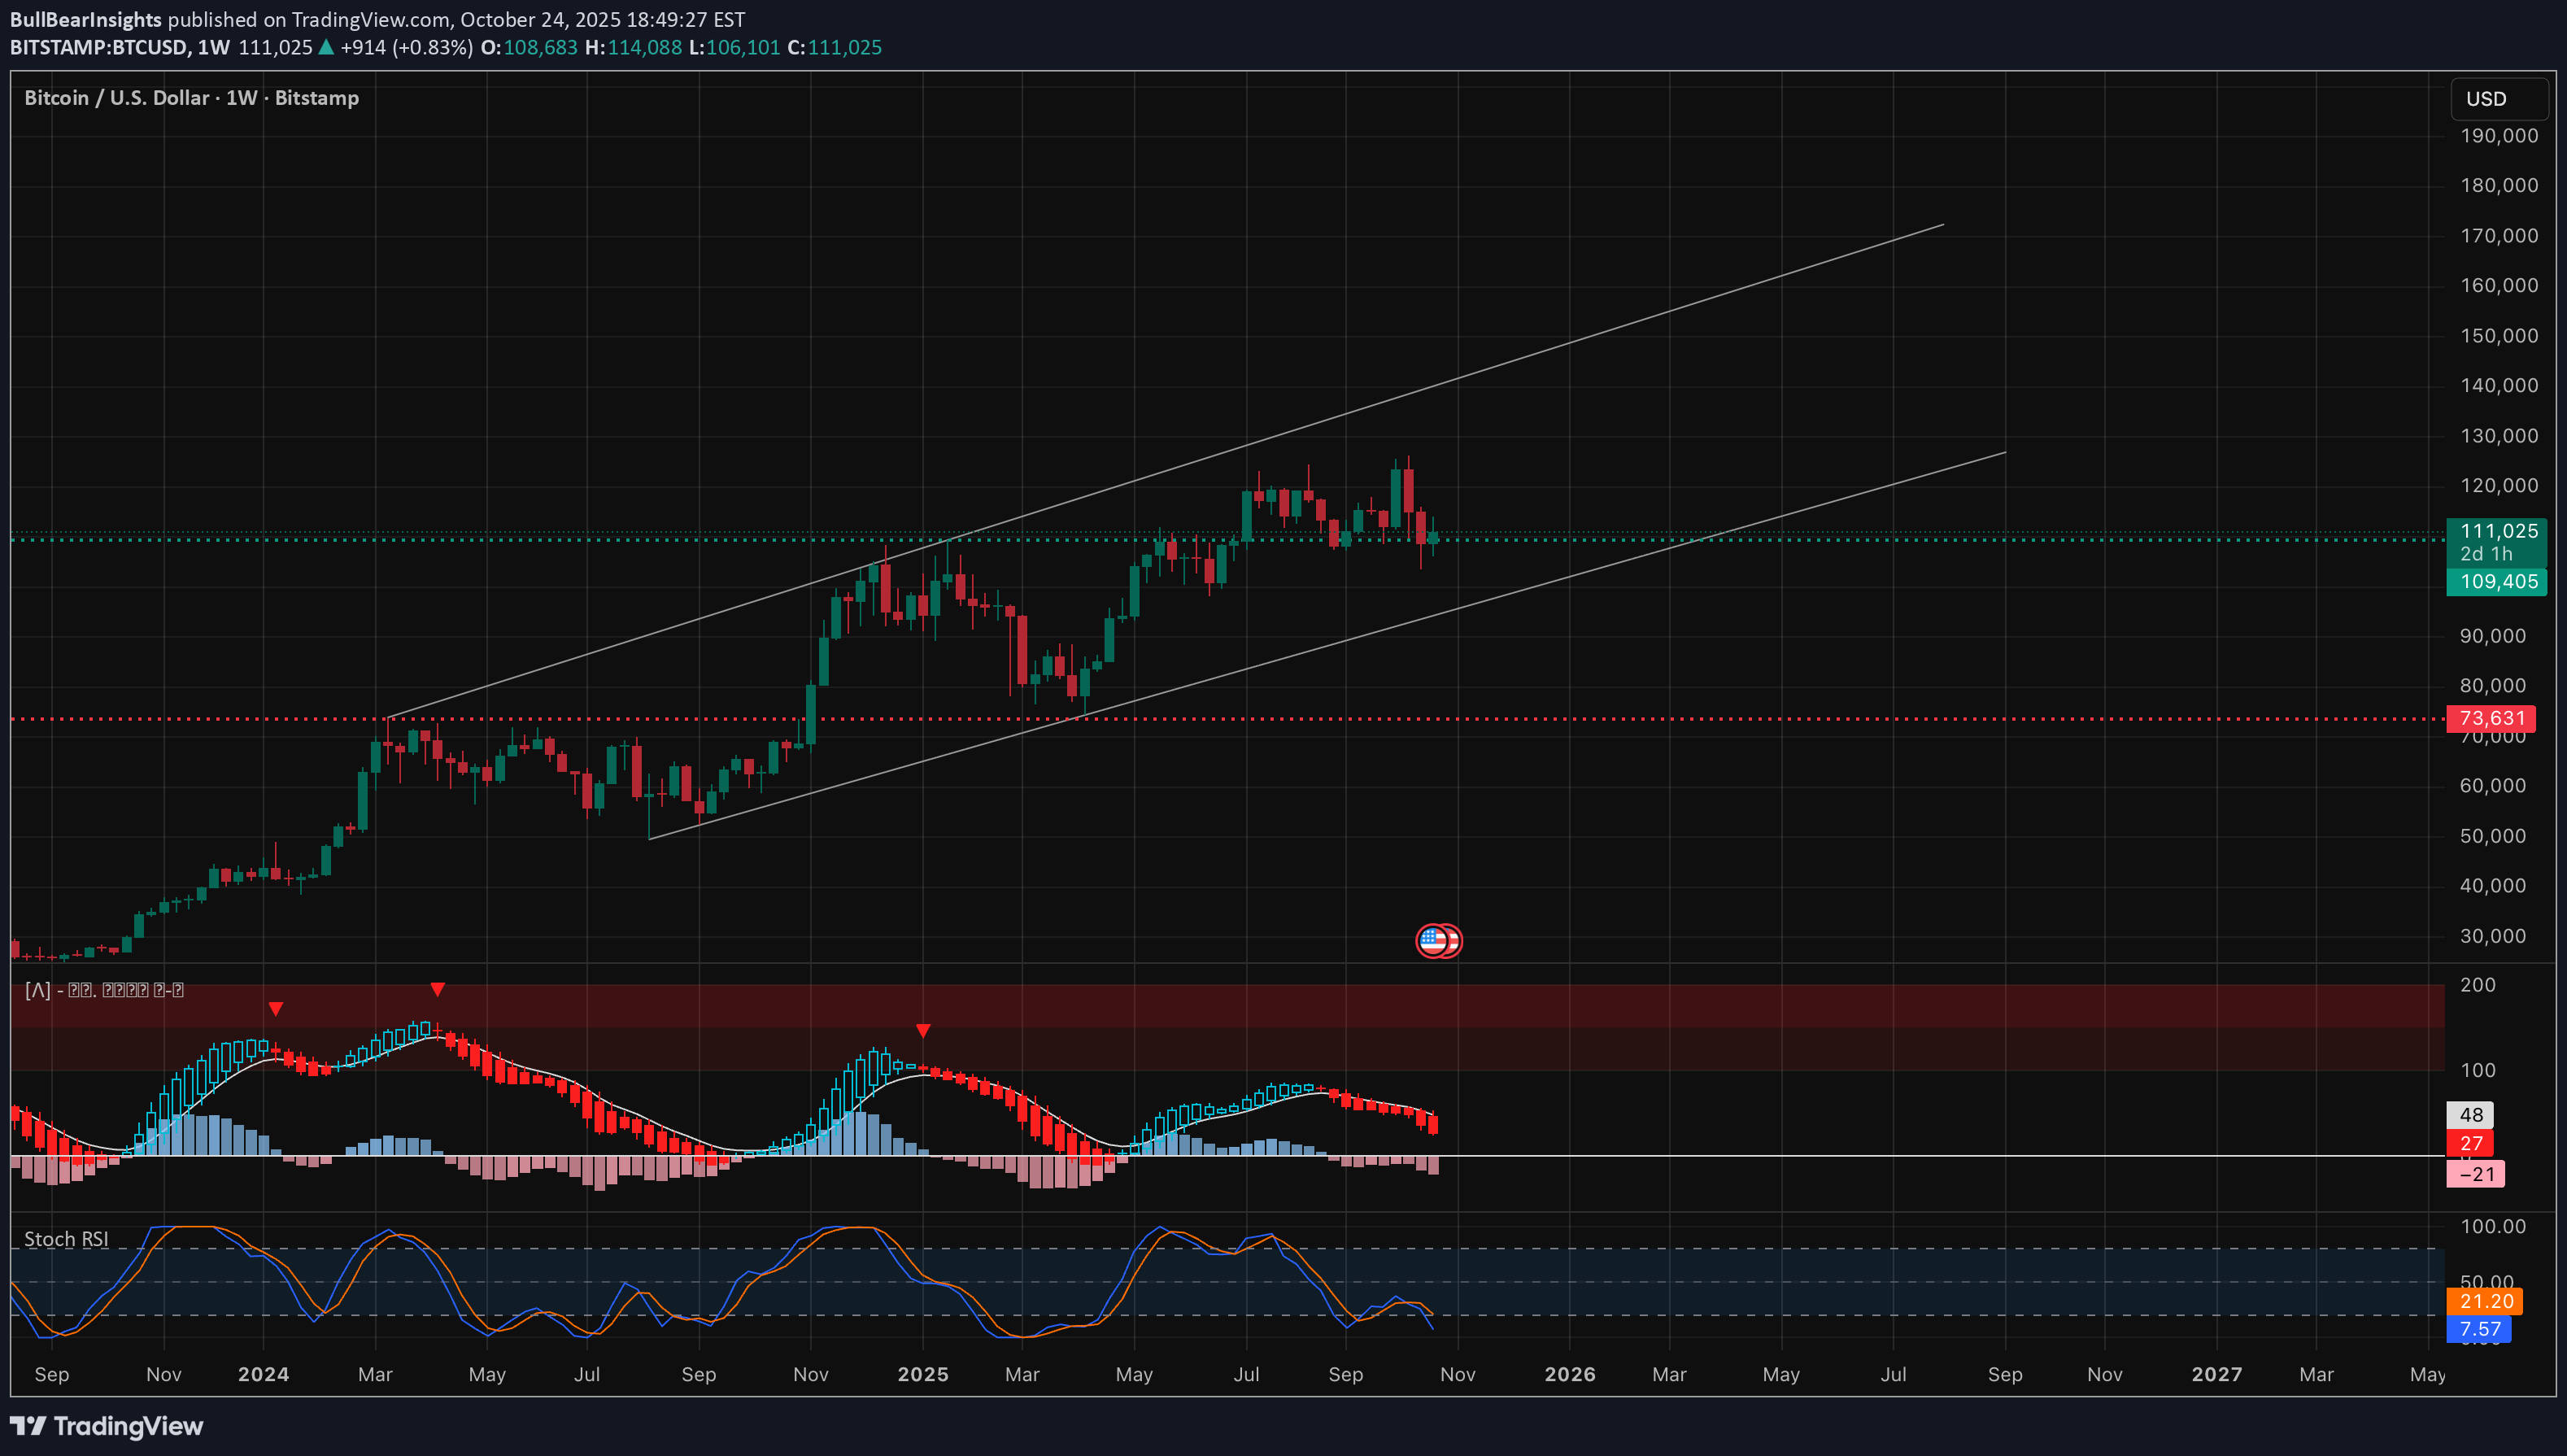
Technical analysis by BullBearInsights about Symbol BTC: Buy recommendation (10/24/2025)

BullBearInsights
بیت کوین در آستانه جهش بزرگ: آیا مقاومت 109 هزار دلاری شکسته میشود؟

Bitcoin Building a Reversal Base — $109K Holding Strong Before Next Expansion 🚀 1️⃣ Weekly Structure (1W) BTC continues to respect its macro ascending channel, maintaining a clear uptrend that’s been in play since early 2023. Despite recent retracements, the structure remains bullish as long as weekly candles hold above $106K. Key Observations: * Structure: Multiple BOS (Break of Structure) levels confirm continuation. The latest pullback looks corrective, not impulsive. * The CHoCH in mid-2025 marked a liquidity sweep before price reclaimed structure again. * MACD: Momentum cooling but flattening — suggesting a potential base forming before next expansion. * Stochastic RSI: Near oversold, starting to curl upward — early bullish signal. Weekly Outlook: Price is consolidating near the midline of the ascending channel (~$109K–$111K). As long as this zone holds, Bitcoin is primed for a macro continuation toward $125K–$130K. If $106K breaks on a weekly close, next strong demand sits at $80K. 2️⃣ Daily Structure (1D) On the daily chart, BTC shows signs of a structural rebound after forming a clean BOS from the $108K zone. Buyers defended the same demand that triggered the last impulse move. Key Observations: * Clear CHoCH → BOS pattern near $108K confirming early accumulation. * MACD histogram is narrowing — bearish momentum fading quickly. * Stochastic RSI rising from the oversold zone — suggests upward rotation beginning. * Major resistance zones sit at $113K → $126K. Daily Outlook: BTC has successfully reclaimed the short-term trendline and is eyeing the $113K pivot. A breakout and daily close above $114K would likely trigger a run toward $124K–$126K. As long as daily closes stay above $108K, bias remains bullish. 3️⃣ 4-Hour Structure (4H) The 4H chart highlights a contracting triangle breakout pattern with a fresh BOS confirming local trend reversal. Price is climbing back from the $109K base after multiple CHoCH sweeps that trapped late sellers. Key Observations: * Price is now riding higher lows, showing buyers defending every dip near $109K. * MACD crossover bullish, histogram expanding positive. * Stochastic RSI flipped up from midline — showing momentum continuation. * Short-term resistance: $114K, followed by $116K. * Support: $109K → $106K remains the key re-accumulation zone. 4H Outlook: BTC is building energy for a short-term breakout leg. If momentum sustains and price closes 4H candles above $111K–$112K, we could see a fast run toward $115K–$118K in the next 48–72 hours. 🎯 Trade Scenarios ✅ Swing Setup: * Buy Zone: $108K–$110K * Stop-Loss: Below $106K * Targets: $118K → $124K → $130K ✅ Intraday/Short-Term Setup: * Entry Trigger: Break and retest above $111.5K * Stop-Loss: Below $110K * Targets: $114K → $116K ❌ Invalidation: Weekly close below $106K would signal breakdown from structure and open potential retrace toward $95K or $80K. 🧠 Final Thoughts Bitcoin’s multi-timeframe confluence shows strength building beneath the surface — higher-low structure, MACD flattening, and Stoch RSI turning up all point to accumulation before next markup. While short-term chop may continue, every dip into the $108K–$109K area looks like an opportunity to scale in for the next macro leg up. If the market confirms with a strong daily BOS above $114K, expect sentiment to flip bullish rapidly as BTC pushes toward $125K–$130K zone into early 2026. Disclaimer: This analysis is for educational purposes only and not financial advice. Always do your own research and manage risk carefully.