Technical analysis by WhiteBIT about Symbol BTC on 10/24/2025
الگو شمع دوجی: راز کلیدی تشخیص چرخشهای بزرگ بازار
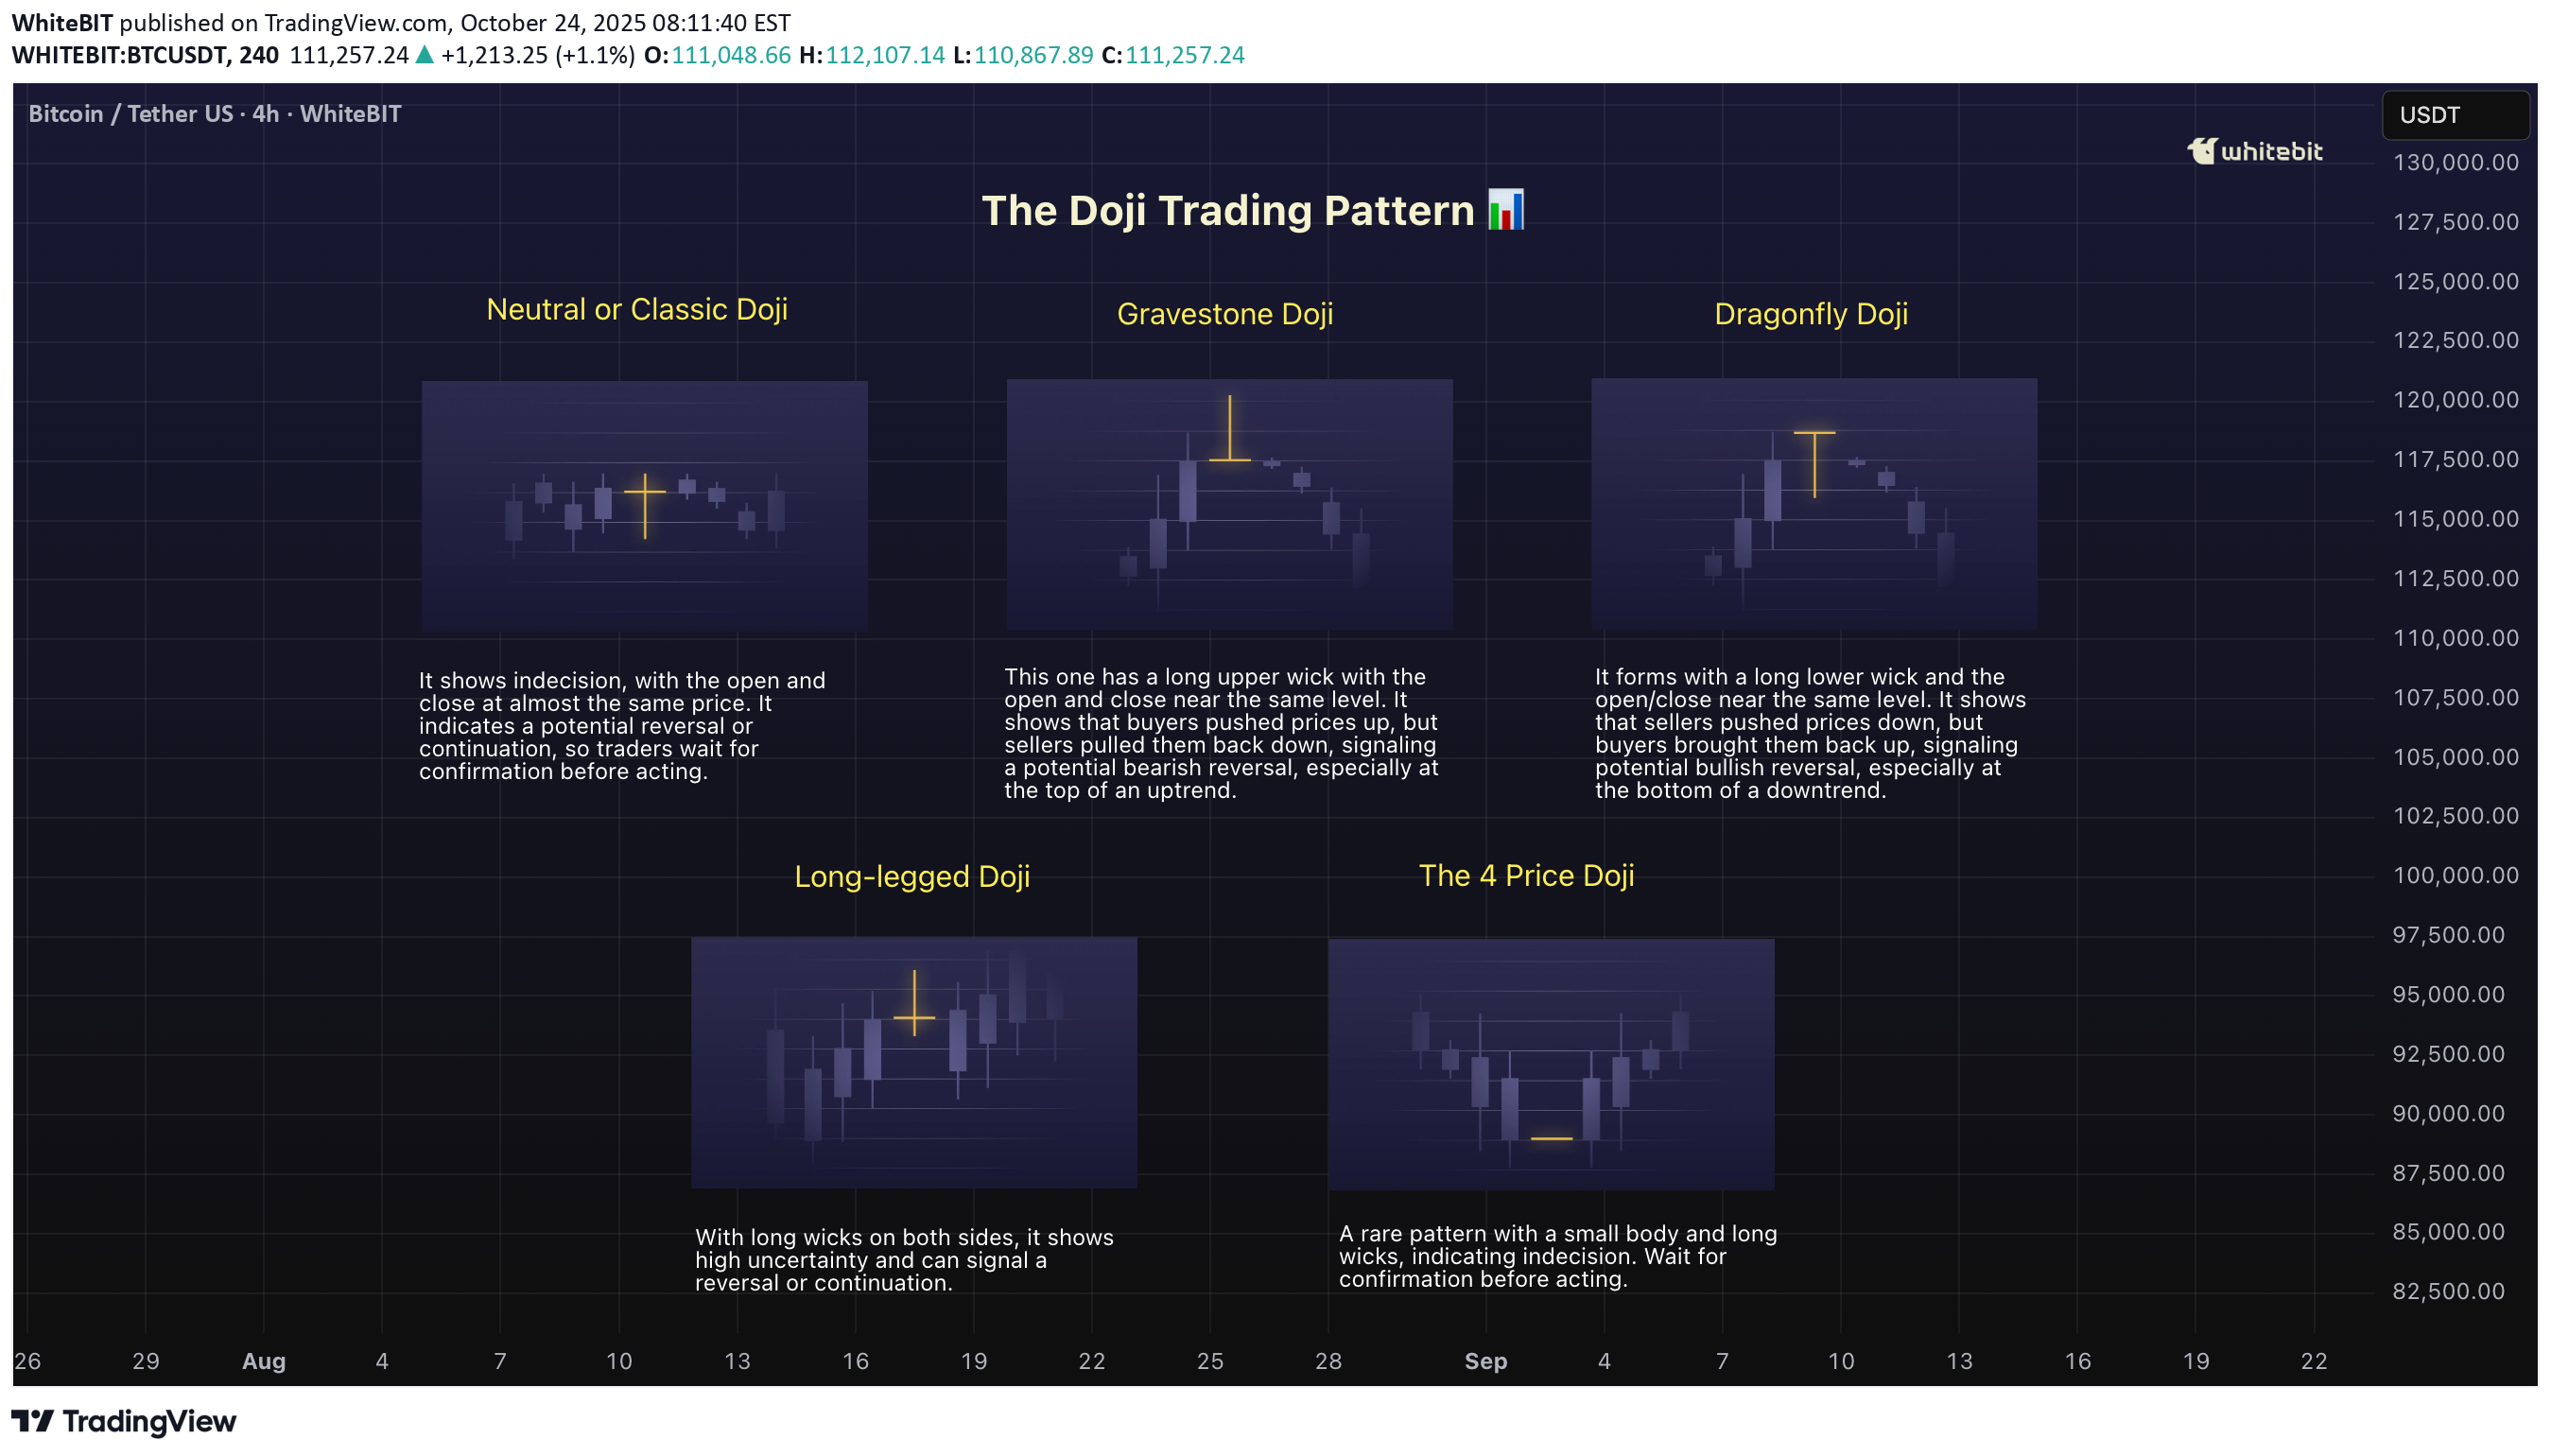
Alright, let’s break down the Doji candlestick pattern. If you're trading crypto, you've probably bumped into this little guy at some point. It’s not a wild trendsetter on its own, but it definitely has something to say about the market’s mood 🤔. The Doji is one of those candlestick patterns you’ll want to pay attention to if you're trying to catch reversals or just understand what's going on in the market. What is the Doji Candlestick Pattern? A Doji candlestick pattern forms when the opening and closing prices are almost identical. The body of the candle becomes tiny, while the shadows (the lines extending above and below the body) are long. It might look like a cross, plus sign, or even an “✖️.” The key point is that the market is indecisive, which is why this pattern gets so much attention. 🐂Bullish Doji Candlestick Pattern So, what happens when you spot a Doji after a downtrend? You might be looking at a potential reversal, signaling that the bears are running out of steam. A bullish Doji candlestick pattern forms when the market closes near the opening price but after a steady downtrend. It’s like the bulls are just waiting for the right moment to step in. But don’t jump in too quickly! A single Doji doesn't mean the market's ready to flip. Look for confirmation in the following candles — ideally, a strong bullish candle that closes above the previous high. 🐻Bearish Doji Candlestick Pattern Now, flip the script. If you see a bearish Doji candlestick pattern after a nice uptrend, it’s time to pay attention. This signals that the bulls might be running out of energy, and the bears could be gearing up for a push. It’s not an instant signal to sell, but it’s a red flag that the market’s strength is weakening. After spotting the Doji, wait for confirmation — usually in the form of a bearish candle that closes below the previous low. How to Use the Doji Trading Pattern Effectively? So you’ve spotted a Doji chart pattern. Now what? This pattern is all about context. If it shows up in the middle of a strong trend, it’s probably just a pause in the action — not a reversal. But, if it appears after a big rally or a significant drop, it could indicate that market sentiment is shifting. Here’s the key: Confirmation is king. The Doji itself doesn’t tell you where the market is going. It only tells you that the market is uncertain. Look for the next few candles to see if they support a reversal — a bullish follow-up candle after a bearish Doji or a bearish candle after a bullish Doji. 🏁Final Thoughts The Doji candlestick pattern can be a valuable addition to your trading strategy, offering insights into market sentiment when combined with other indicators. While it highlights moments of indecision, it's essential to exercise caution and not rely solely on a single signal. In trading, context, confirmation, and proper risk management are key. Remember, tools like the Doji are meant to inform your decisions, but ultimately, it's your judgment and strategy that will guide your moves. Happy trading!