Technical analysis by CryptoNuclear about Symbol MEME: Buy recommendation (10/24/2025)

میم کوین در دوراهی مرگ و زندگی: آیا کف قیمتی تشکیل میشود یا سقوط نهایی در راه است؟
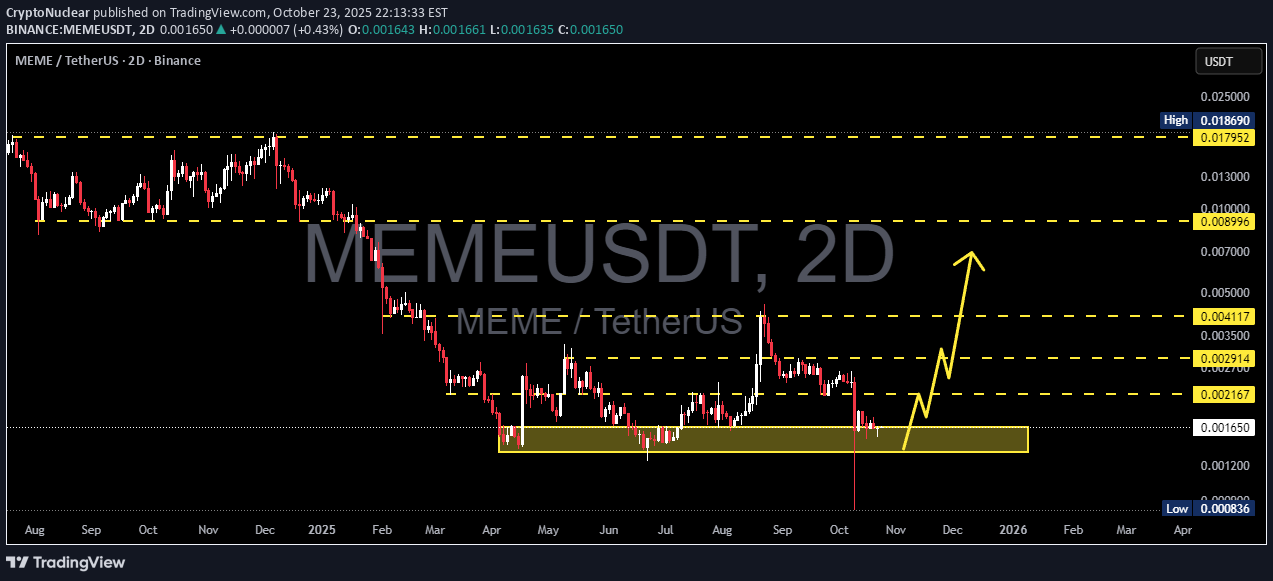
📉 Overview MEME/USDT is standing on the edge — between a massive accumulation opportunity and complete market capitulation. The price is now sitting right above the major support zone (0.0012 – 0.00165 USDT), a key defensive area that has been tested multiple times since April 2025. Each visit to this zone has triggered liquidity absorption and stop hunts, followed by short-lived recoveries — but never a sustained reversal. Now, once again, the market is testing this zone for survival. --- 🧩 Price Structure & Technical Context Primary trend: Long-term downtrend since late 2024, forming consistent lower highs and lower lows. Dominant pattern: Potential accumulation base following a liquidity sweep — a classic signal of possible smart-money accumulation. Recent wick reaction: Sharp downward wick that was quickly absorbed — often a sign of institutional defense or smart buyer entry. Highlighted zone: This yellow box is more than just support — it’s the psychological boundary between recovery and collapse. --- 📈 Bullish Scenario — “Rebirth from the Bottom” If the price manages to close above 0.0017 and successfully flip this zone into support, it may trigger the beginning of a structural reversal phase. Potential targets: Target 1: 0.002167 → first resistance / short-term profit zone. Target 2: 0.002914 → key validation level for continuation. Target 3: 0.004117 → structural confirmation of trend reversal. Key confirmation: A 2D candle close above the box, followed by a clean retest and sustained momentum. If volume expands, a mid-term rally could unfold. Technical narrative: This setup could evolve into a textbook case of “liquidity sweep followed by a reversal.” If confirmed, it might mark the start of a major accumulation cycle ahead of the next hype phase. --- 📉 Bearish Scenario — “The Final Floor Breaks” If the price fails to hold above 0.0012, the next meaningful support lies near 0.000836, the previous low. A confirmed breakdown below this zone would imply: The end of the accumulation phase, Entry into full capitulation, And a likely panic-driven selloff as retail stop-losses are triggered en masse. Bearish confirmation: 2D candle close below the support zone with a strong follow-through. If that happens, bulls are temporarily out of the game until a new structure forms at lower levels. --- 🎯 Summary This yellow zone is not just another support area — it’s the psychological battlefield where smart money decides the next chapter. The market is now in a quiet tension before the storm: Either we witness a legendary rebound from deep accumulation, Or the final breakdown of a fading trend. For disciplined traders, this is not the time to guess — this is the time to prepare for both outcomes with precision and patience. --- ⚙️ Risk Management Strategy Only enter after clear confirmation (2D close + retest). Risk per trade: 1–3% of total capital. Take partial profits at each target. Move stop-loss to breakeven once Target 1 is reached. --- 🧭 Additional Notes Mid-term bias remains bearish, but early signs of re-accumulation are emerging. This isn’t just another random bottom — it’s a strategic battlefield between smart buyers and aggressive sellers. --- #MEME #MEMEUSDT #AltcoinAnalysis #CryptoReversal #LiquiditySweep #SupportZone #BreakoutWatch #CryptoTechnicalAnalysis #SwingTrading #SmartMoneyConcepts #MarketStructure