Technical analysis by tradecitypro about Symbol BNB: Buy recommendation (10/23/2025)

tradecitypro
آیا BNB به قله تاریخی جدید میرسد؟ تحلیل حساس گارد صعودی و نزولی!
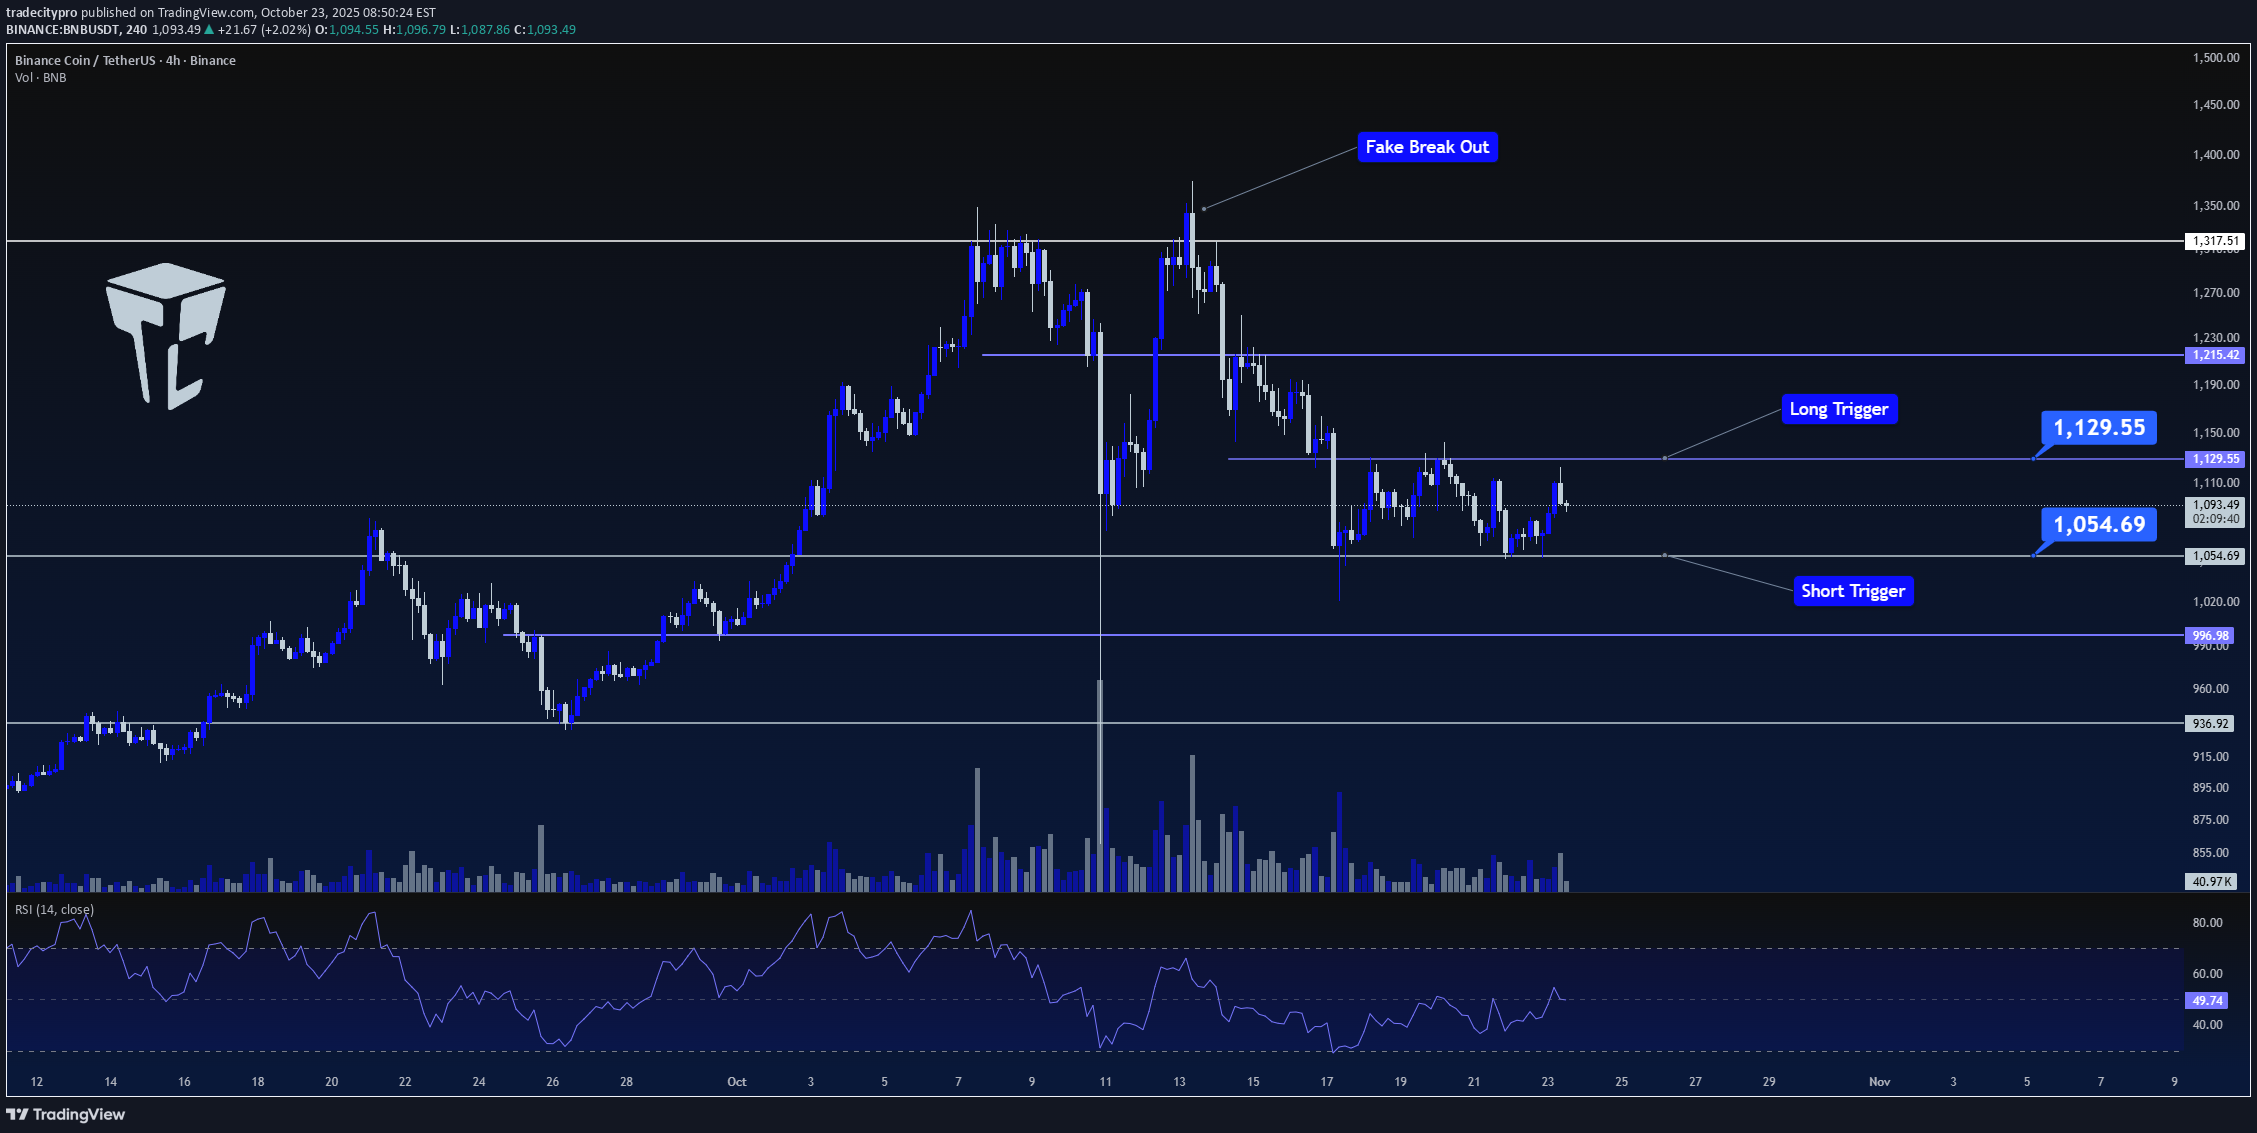
👋 Welcome to TradeCityPro Channel! Let’s dive into the BNB (Binance Coin) analysis — one of the strongest and most bullish charts in the market. Currently, after correcting from its All-Time High (ATH), the price is consolidating within a sideways range, showing that buyers and sellers are in a tug-of-war. 🌐 Overview of Bitcoin Before we begin, note that we’ve moved the Bitcoin analysis to a dedicated daily report for deeper insights into its market behavior, dominance, and trend structure: 👉 TradeCityPro Bitcoin Daily Analysis 📊 Technical Overview (4H Timeframe) After facing a heavy rejection from its ATH, BNB once again attempted to retest that level. However, a fake breakout (false move above resistance) led to another sharp correction, pushing the price back down into the range. Interestingly, this correction bounced exactly from the $1054 support zone, the same level that previously acted as a strong reversal point. This repeated reaction confirms how critical this support is — not only because it aligns with the 50% Fibonacci retracement level, but also due to its importance in the Dow Theory structure as a mid-wave equilibrium. 📈 Long Setup (Bullish Scenario) If price breaks above $1129, it could trigger an early long position setup — signaling that buyers are regaining control before another major leg up. This move would likely be the early breakout signal ahead of a potential new ATH attempt. 📉 Short Setup (Bearish Scenario) For short positions, the $1054 level remains the key trigger. A clean breakdown below this zone would indicate the loss of a major support and could open the way for a deeper retracement. However, keep in mind — this is a high-impact support zone, so avoid placing tight stop-losses or over-leveraged entries. Price volatility is expected to increase around this level. 🎯 Conclusion BNB remains one of the strongest altcoins structurally, and as long as it holds above the $1050 region, the bullish structure remains valid. The next few sessions will be crucial — watch the $1129 breakout for confirmation of renewed bullish momentum, or the $1054 breakdown for signs of weakness. 📝 Final Thoughts Stay calm, trade wisely, and let's capture the market's best opportunities! This analysis reflects our opinions and is not financial advice.