Technical analysis by EconomicanalysAbdulRahman about Symbol PAXG on 10/21/2025

EconomicanalysAbdulRahman
هشدار جدی برای طلا: آیا ریزش تصحیحی آغاز میشود؟ (تحلیل دبل تاپ)
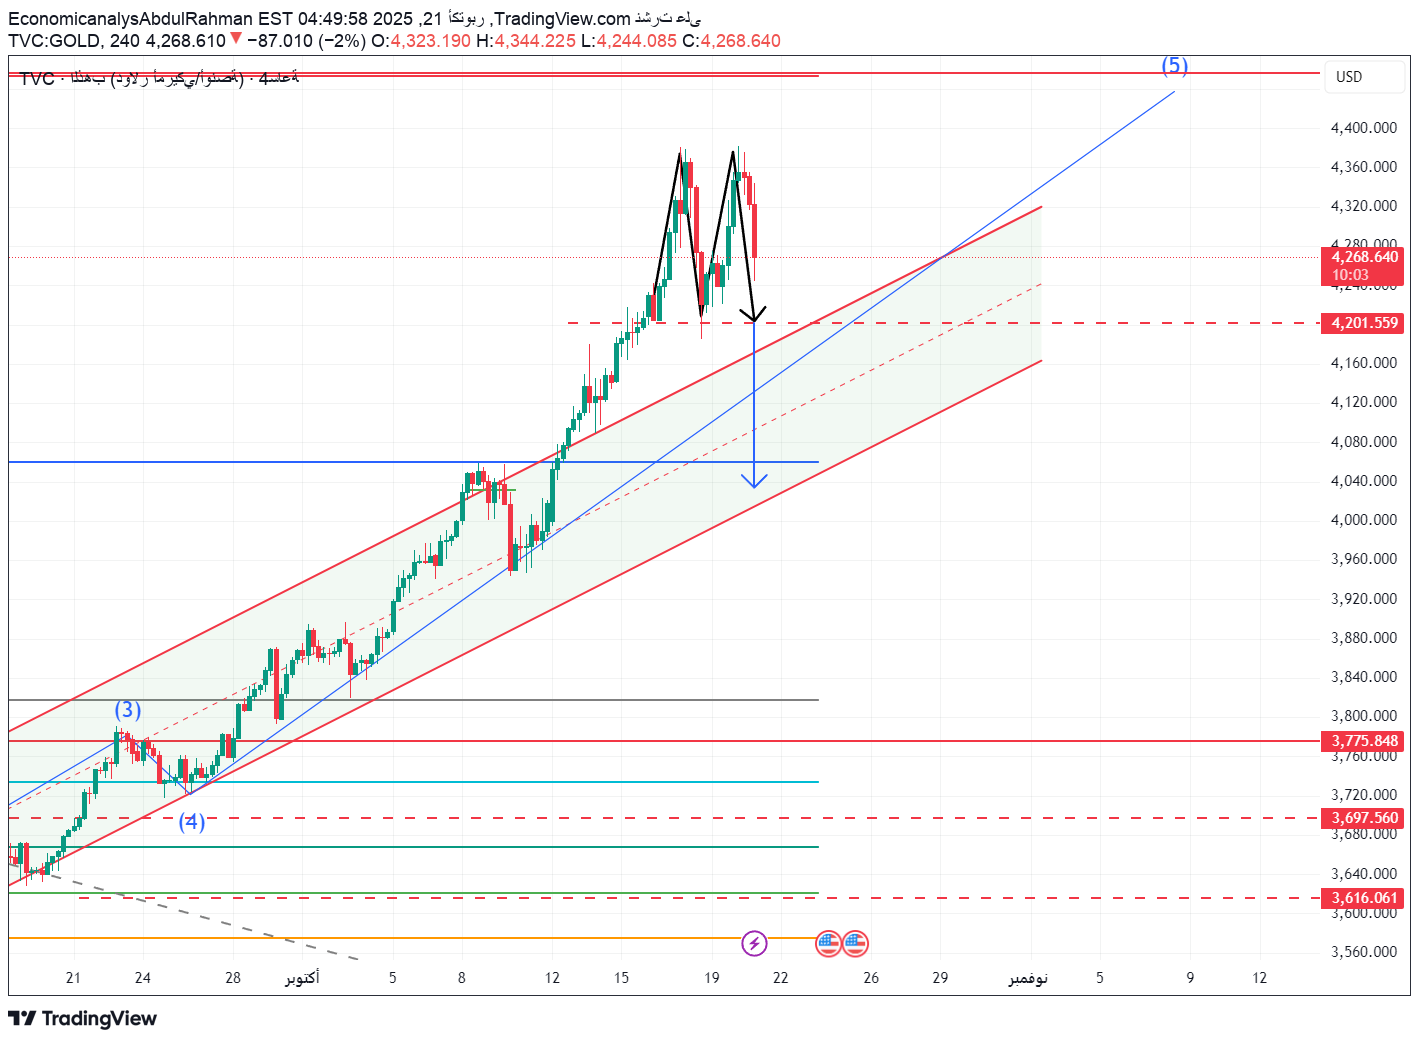
🟡 Gold analysis today – Tuesday, October 21, 2025 An artistic and essential view of the American period Today, gold prices (XAU/USD) witnessed a noticeable decline from their weekly peaks near $4,340 per ounce, to currently trade around $4,266, with a decline of more than 1.3%, after the emergence of a Double Top reversal technical pattern on the four-hour time frame, indicating the possibility of the start of a bearish correction in the short term. 🔹 Technical analysis From the graph, it is clear that: A clear Double Top pattern has formed in the $4,340-$4,344 area, with a neckline at around $4,201. A break of this line lower activates the technical pattern and indicates a possible downside towards the approximate target at $4,100 - $4,050. The main uptrend is still in place as long as the price remains inside the red ascending channel, but the loss of upward momentum is evident at the moment. 📊Main support areas: $4,201 – The neckline of the pattern, short-term pivotal support. $4,060 – 1.618 Fibonacci extension of the previous wave and strong technical support. $3,775 – $3,700 – Medium-term support area, representing the base of the previous fourth wave. $3,499 – Long-term strategic support (end of previous wave). 🔺 Important resistance areas: $4,300 – $4,340 – The top of the double top pattern, a strong selling area. $4,456 – $4,488 – the upper target resistance in the event of failure of the correction and resumption of the rise towards wave (5). 🔸 Possible scenarios for the American period 🔹 Bearish scenario (most likely - 60%) If gold breaks the $4,201 level with a clear close, the decline is expected to continue towards $4,100 initially, and the movement may extend to $4,050. The downward moves will remain corrective as long as the price does not break the deeper bottom at $3,775. 🔹 Bullish scenario (40% probability) If the price holds above $4,200 and bounces from it, we may see a retest of the $4,300-$4,340 resistance. Breaking this area will invalidate the double top pattern and open the way again towards $4,450 - $4,480 (targeting the fifth ascending wave). 📰 Today's most important news The US dollar fell slightly at the beginning of the European session, limiting gold's losses, but US bond yields are still high and putting pressure on the metal. Markets are awaiting the speech of US Federal Reserve officials this evening, searching for signals regarding the upcoming monetary policy. Actual demand for physical gold (bullion and jewellery) is witnessing some slowdown in Asia as prices rise to historic levels. 💡 Tips for traders and savers 🎯 For active traders (American period): The $4,201 area can be monitored as a crucial level to confirm the upcoming trend. Selling opportunities get stronger by breaking this level towards $4,100 and $4,050. As for safe buying, it is only after the price returns above $4,300 with confirmation of strong momentum. It is preferable to place stop loss orders above $4,345 in case of selling. 🪙For savers and investors (physical): It is preferable to wait until the expected correction is completed, as better buying opportunities are likely to be available between $4,060 and $3,900. The general trend remains bullish in the long term as long as the $3,775 level is not broken. Demand for physical gold remains high globally, supporting a positive long-term outlook. 🔻 Conclusion Gold shows signs of correction after forming a Double Top pattern on the medium frame. A break below $4,201 will confirm the price entering a corrective downward wave towards $4,100 - $4,050. On the other hand, stability above 4,200 will keep the possibility alive for a return to $4,340 - $4,480 before any new decline.