Technical analysis by Pepperstone about Symbol PAXG on 10/20/2025
Pepperstone
طلا: اصلاح قیمت یا بازگشت کامل؟ آینده قیمت طلا در هالهای از ابهام!
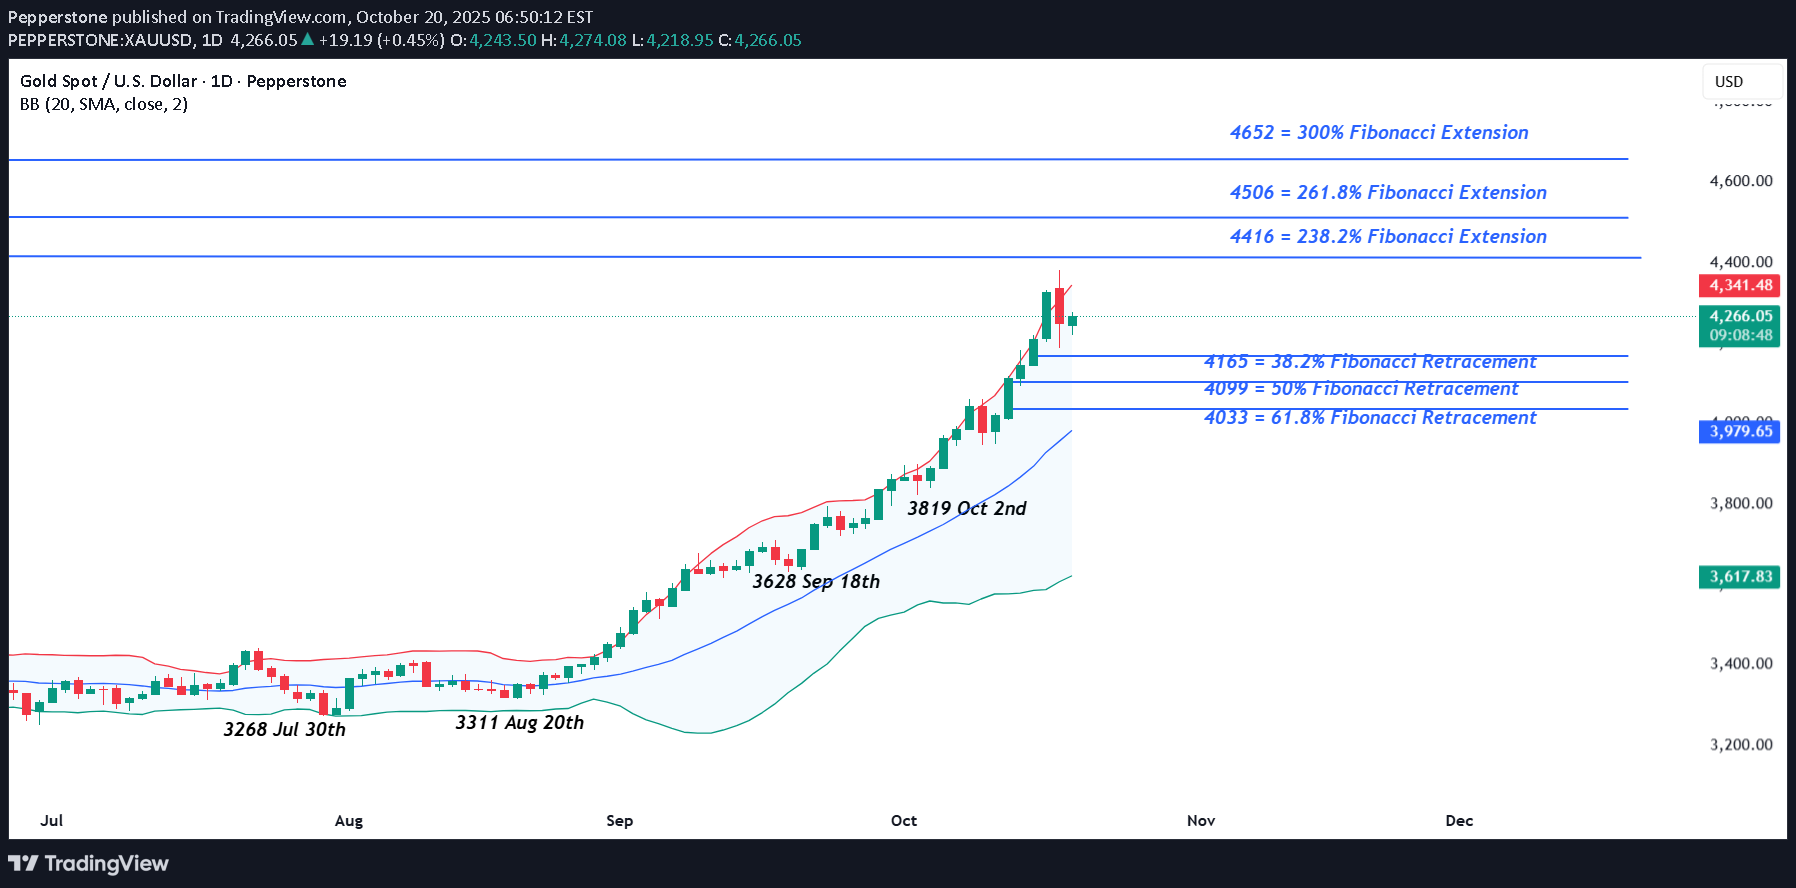
Gold volatility picked up dramatically last week as concerns regarding the ability of regional US banks to absorb losses from bad loans jostled for position as the new reason for owning Gold as a safe haven hedge with escalating trade tensions between the US and China. These drivers joined a growing list of problems supporting why traders and investors could be so focused on adding Gold, and other precious metals, to their portfolios including geo-political risks in Ukraine and the Middle East, unsustainable government debt levels in countries like the US, Japan, France and the UK, as well as the potential for more interest rate cuts from the Federal Reserve. To showcase how volatility has increased, last week Gold traded from its Monday open at 4012 to a new record high on Friday of 4379, before reversing direction to close the week at 4247. Despite a 1.8% fall on Friday, it still posted a weekly gain of 5.8% and on the way registered its biggest ever weekly price gain in dollar terms (+$235). This type of movement could reflect the increased involvement of speculators in Gold, which can exaggerate price moves as they are quicker to enter and exit positions. When considering trading Gold in this type of environment it could be worthwhile looking to reduce position sizes to account for bigger price swings and accommodate the need for wider stop loss and take profit parameters. Keeping apprised of scheduled event risk can also be useful, for example, the release on Friday (1330 BST) of the delayed US CPI reading, which could influence whether Federal Reserve policymakers feel they are able to cut interest rates by 25bps (0.25%) at their meeting on October 29th. Identifying and monitoring key technical levels and trends can also be important. Technical Update: Price Correction, or Price Reversal? From the August 20th low into Friday’s new all-time high, Gold has risen an impressive 32.25%, reflecting a sustained uptrend. As illustrated in the chart below, corrections during this phase of strength have been brief, typically lasting just one session, with only a single instance of a two-day pullback (marked by the red candles). Each dip has consistently attracted fresh support, helping prices post successive highs and reinforcing the strength of the underlying upside momentum. This recent activity underscores the positive sentiment behind Gold, despite traditional indicators having signalled stretched upside conditions for some time. Notably, Bollinger bands continue to reflect a positive technical backdrop, with the mid-average rising, price action touching the upper band, and the bands widening, a sign of increasing price volatility and upward momentum. Friday’s pullback following the new all-time high at 4379 may be sparking fresh debate among traders, whether this is just another brief correction, as seen during the current uptrend, or the start of a more extended phase of weakness. Historically, similar dips have quickly attracted support, but upcoming sessions may prove pivotal in determining whether upside momentum can resume or if a period of deeper consolidation is on the horizon. In this type of environment it may be prudent to establish potentially relevant support and resistance levels to monitor that could have an impact on the direction of Gold prices. Potential Support Levels: Price corrections following strong advances are a typical market response to short-term upside overextension, and Gold may well be entering such a phase. Traders could now focus on 4165 as the first key support, which is the 38.2% Fibonacci retracement of the October strength. This level holding if price weakness is seen, could stabilise sentiment, while a closing break lower may lead to a deeper pullback. A closing break below 4165 wouldn’t necessarily signal a shift in downside sentiment, but it could open tests of 4099, the 50% Fibonacci retracement, even towards 4033, a level equal to the deeper 61.8% level. Potential Resistance Levels: Having stalled on Friday at the 4379 level it is possible this now marks initial resistance for the coming week. If the uptrend pattern from the August 20th low is to persist, a close above 4379 may lead to a more extended phase of price strength. While not a guarantee of higher price levels, successful closes above 4379 may open scope toward 4416, the 238.2% Fibonacci extension, and if this gives way on towards 4506, which is equal to the 261.8% extension. The material provided here has not been prepared accordance with legal requirements designed to promote the independence of investment research and as such is considered to be a marketing communication. Whilst it is not subject to any prohibition on dealing ahead of the dissemination of investment research, we will not seek to take any advantage before providing it to our clients. Pepperstone doesn’t represent that the material provided here is accurate, current or complete, and therefore shouldn’t be relied upon as such. The information, whether from a third party or not, isn’t to be considered as a recommendation; or an offer to buy or sell; or the solicitation of an offer to buy or sell any security, financial product or instrument; or to participate in any particular trading strategy. It does not take into account readers’ financial situation or investment objectives. We advise any readers of this content to seek their own advice. Without the approval of Pepperstone, reproduction or redistribution of this information isn’t permitted.