Technical analysis by Nabi_Gunduz about Symbol PAXG on 10/18/2025

Nabi_Gunduz
طلا و سکه در قله تاریخی: آیا صعود ادامه دارد یا منتظر ریزش بزرگ باشیم؟
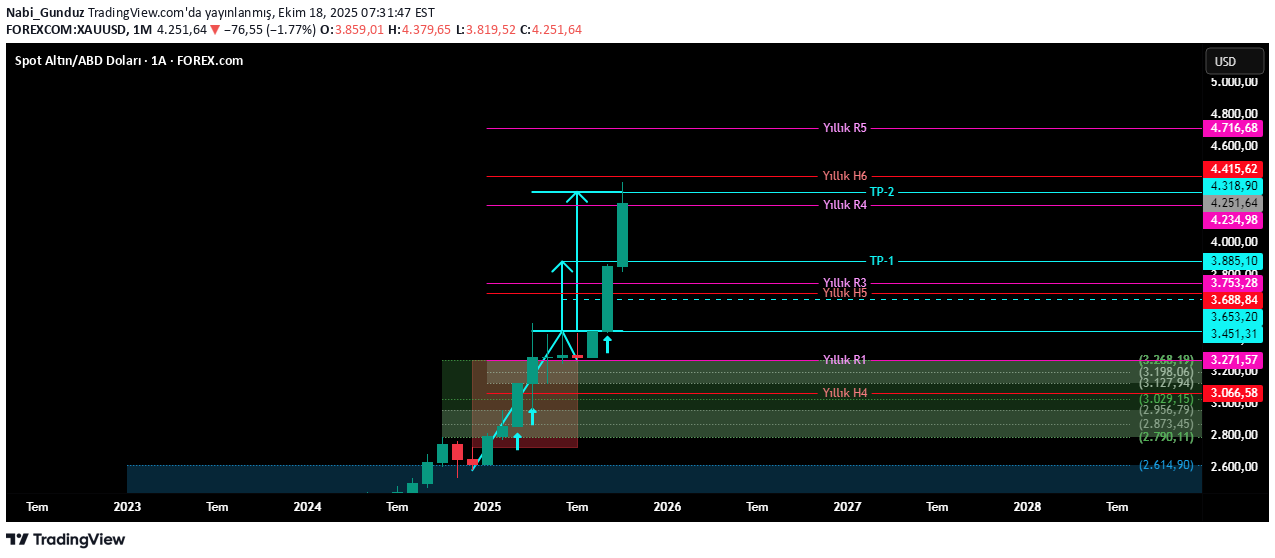
Hello, I shared it on October 1, after the closing of September. General Evaluation After Monthly Closing I shared this chart in my analysis and stated that since the monthly candle closing for September was above the annual R3, the price could target the annual R4 level and even the 4318 level, which is the main target of the monthly upward formation that I show in blue on the chart. The goals came very quickly. Such rapid and voluminous increases worry people. Levels like R4 or H6 are difficult to reach levels and are exception moves. Although there are still 2 and a half months until the end of the year, the fact that these levels have been reached increases concerns. So will the price continue to rise? Of course he can. Those who invest in physical gold or gram gold investors can continue their investments by taking risks. As a result, even if there are sharp withdrawals, they can risk some of their profits because they invest with the spot transaction logic, but those who make leveraged transactions should be very careful in upward transactions. Volatility is extremely high and the severity of pullbacks can be very strong. This can cause serious damage or even sinking. As seen in the chart, the maximum the price can go is R5 by the end of the year. Believe me, it is very difficult to predict the future before the 2026 values are formed... Maybe the levels you see on this chart can be followed with monthly closing candles. For example, a monthly candle that closes above 4402 before reaching 4804 could prompt the price to target other levels ahead. You can shape your trade by using smaller time frames and capturing signals with new formations. For example; I shared with you the upward formation you see in blue on the chart, which is in the 4-hour time period, in my analysis last weekend. The formation, which generated a signal with the closing of the first 4-hour candle on Monday, reached its target in the second 4-hour candle the next day. A new bullish formation formed on the same day (seen in green color) and produced a Buy signal with the close of the second 4-hour candle on Wednesday, but I could not share it with you because I did not share much analysis during the week. As you can see, this formation also reached its goal with 4 points missing... So what I'm saying is this: you have to scan small time frames very well. It has not completed its formation yet, but a daily candle closing above 4379.19 can run the formation seen on the chart and possible targets are seen on the chart. In the 4-hour time frame, there is a bearish formation that will generate a SELL signal with a 4-hour candle closing below 4185. In this chart, the IFVG region above the price in gray and the FVG region in pink should be followed as resistance. Daily pivot for Monday: 4272.28 Weekly pivot next week: 4212.89 It would not be technically correct to open a BUY trade on Monday without seeing the 4-hour candle close above 4272.28. On the other hand, it is not technically correct to open a SELL transaction without closing the daily candle below 4212.89 next week. If you ask if this is not a paradox, no it is not. The technique tells you not to open a transaction until the conditions are met, but to wait without a transaction. I wish you all a happy holiday... I am also adding this work that I forgot to share...