Technical analysis by WhiteBIT about Symbol BTC on 10/16/2025
الگوی چکش دار (Hanging Man): راز شناسایی سقوط بازار در اوج صعودی!
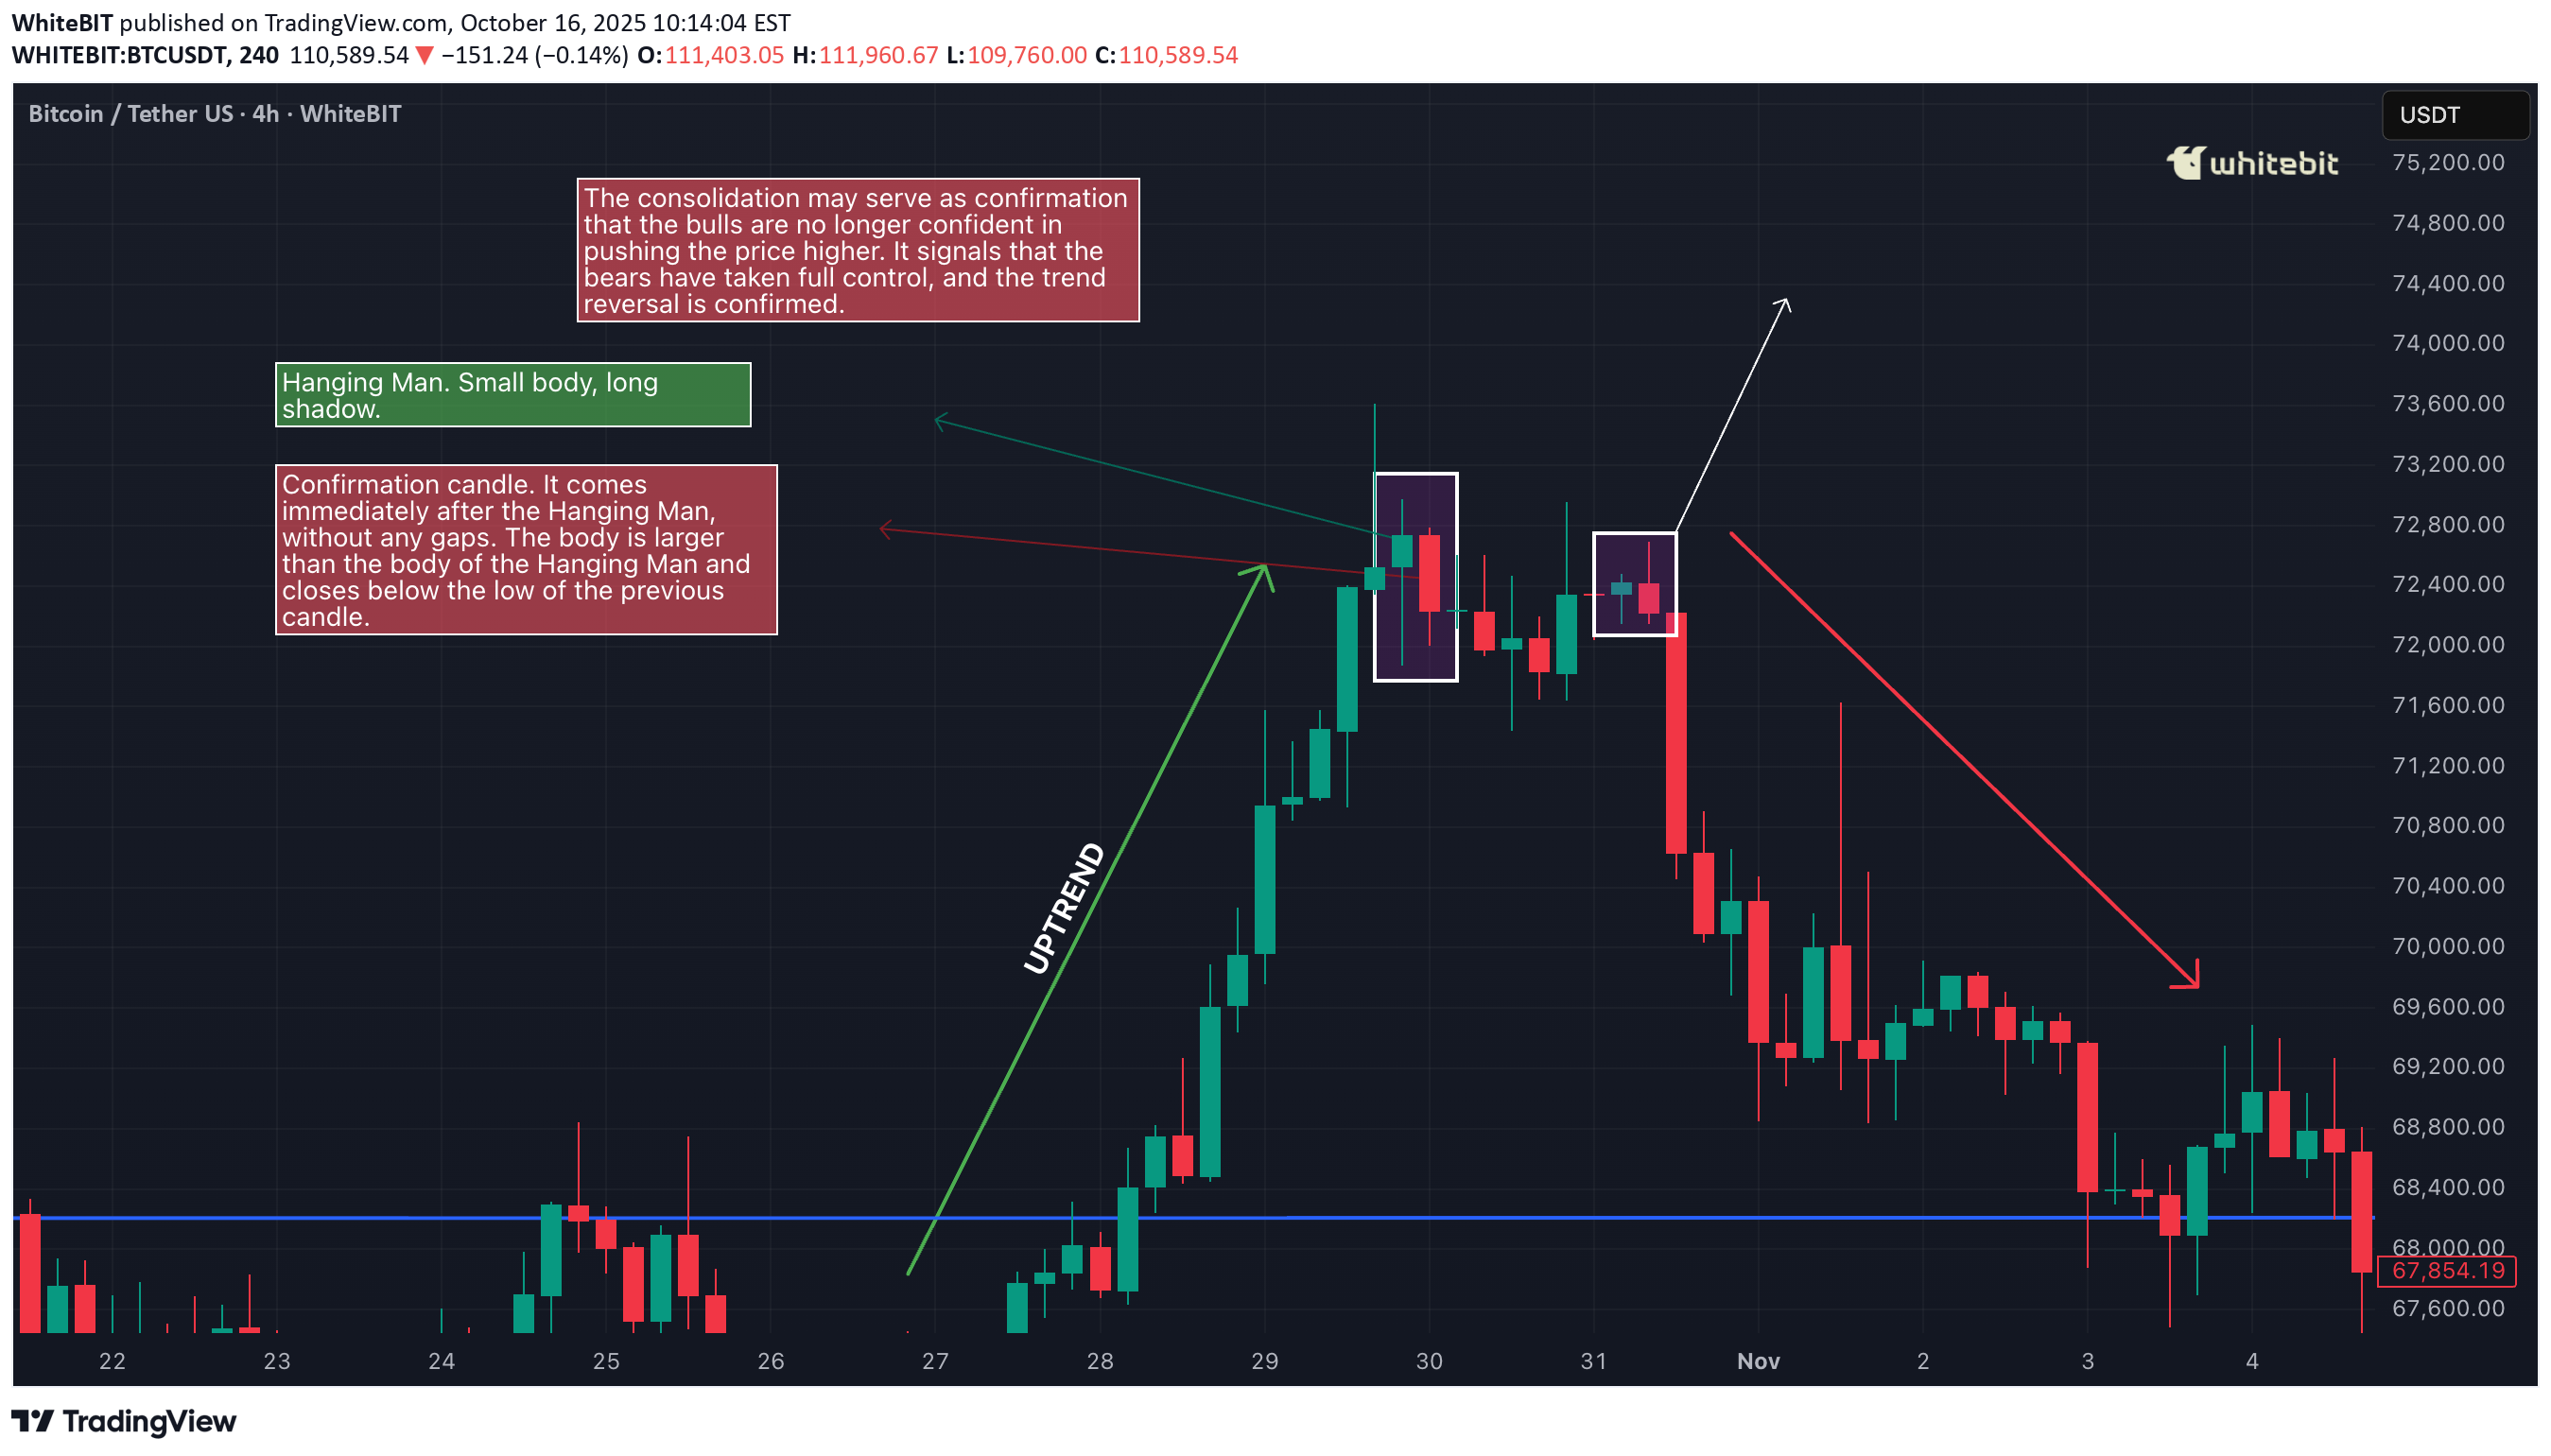
Alright, traders, let’s talk about the Hanging Man candlestick pattern. This one’s a classic, and if you know what you’re looking at, it can be a game changer when you’re spotting potential reversals. So, what exactly is the Hanging Man pattern, and how can you use it to your advantage? Let’s break it down. What Is the Hanging Man Pattern? The Hanging Man pattern appears when the market has been pushing higher, and then—bam—a sign that it could be running out of steam. It’s called the Hanging Man chart pattern because the candlestick looks like a little figure hanging by its feet, with a long lower wick. The body is small, and the lower shadow is long—typically at least twice the size of the body. This shows that while buyers were in control, sellers came in strong towards the end of the session, pushing prices lower. Hanging Man candles can be red or green. Even though the candle is green, it still suggests the same potential reversal because the rejection of higher prices by the sellers shows weakening bullish pressure. The key point to remember is that the Hanging Man candle pattern signals potential exhaustion in an uptrend. It doesn’t guarantee that the trend is reversing, but it highlights that the bullish momentum is waning, which could be a sign that a reversal is near. Where to Look for the Hanging Man Pattern? Context is everything. The Hanging Man pattern is much more significant when it appears at the top of an uptrend. In this case, it suggests that buyers are losing control, and the market could soon turn bearish. If it appears after a downtrend, it’s known as an Inverted Hammer, and its interpretation is different—it could signal a potential reversal to the upside. So, while the Hanging Man is typically seen as a bearish reversal indicator after a sustained uptrend, it is crucial to recognize that the context matters. A Hanging Man at the peak of a strong bullish trend often attracts attention from traders as a potential signal for a shift in momentum. How to Confirm the Reversal? The key to using the Hanging Man pattern effectively is the confirmation candle. After spotting the Hanging Man candlestick pattern, you’ll want to wait for a bearish candlestick in the next session that closes below the low of the Hanging Man candle. This confirms that sellers have taken control and that the market is likely heading lower. It’s also important to consider the volume during the confirmation. A strong bearish Hanging Man pattern with higher-than-usual volume adds strength to the reversal signal. If the confirmation candle has low volume, it might not carry as much weight, so always consider the volume when confirming the pattern. However, the Hanging Man candlestick pattern is not foolproof. A Hanging Man trading pattern without confirmation can sometimes lead to a false reversal, especially in markets with high volatility or when the overall trend is still strong. False Signals and Pitfalls One of the biggest challenges when trading the Hanging Man pattern candlestick is false signals. In choppy or sideways markets, the pattern may form but fail to lead to a true reversal. To avoid these traps, consider waiting for the confirmation candle and also use other tools to verify the signal, like: Trendlines: Ensure the market is actually in an uptrend before considering the Hanging Man pattern. Support/Resistance Levels: Wait for a breakdown below a significant support level to increase confidence in the reversal. Momentum Indicators (e.g., RSI or MACD): Use momentum indicators to confirm that buying pressure is truly weakening, as suggested by the Hanging Man pattern. These additional tools can help you filter out false signals and increase the reliability of your trades. The Hanging Man pattern can be a valuable tool when used correctly, but it’s not a standalone signal. It works best when combined with other forms of technical analysis, such as momentum indicators, trendlines, and volume analysis. Be patient, wait for confirmation, and always manage your risk. The Hanging Man trading pattern is a great addition to your candlestick pattern toolbox, but it should be used as part of a broader strategy that includes multiple indicators and sound risk management.