Technical analysis by StudyGuideTA about Symbol XLM on 10/16/2025
StudyGuideTA
راز سطوح 4 ساعته: تحلیل سریع نمودار با تمرکز بر XLM
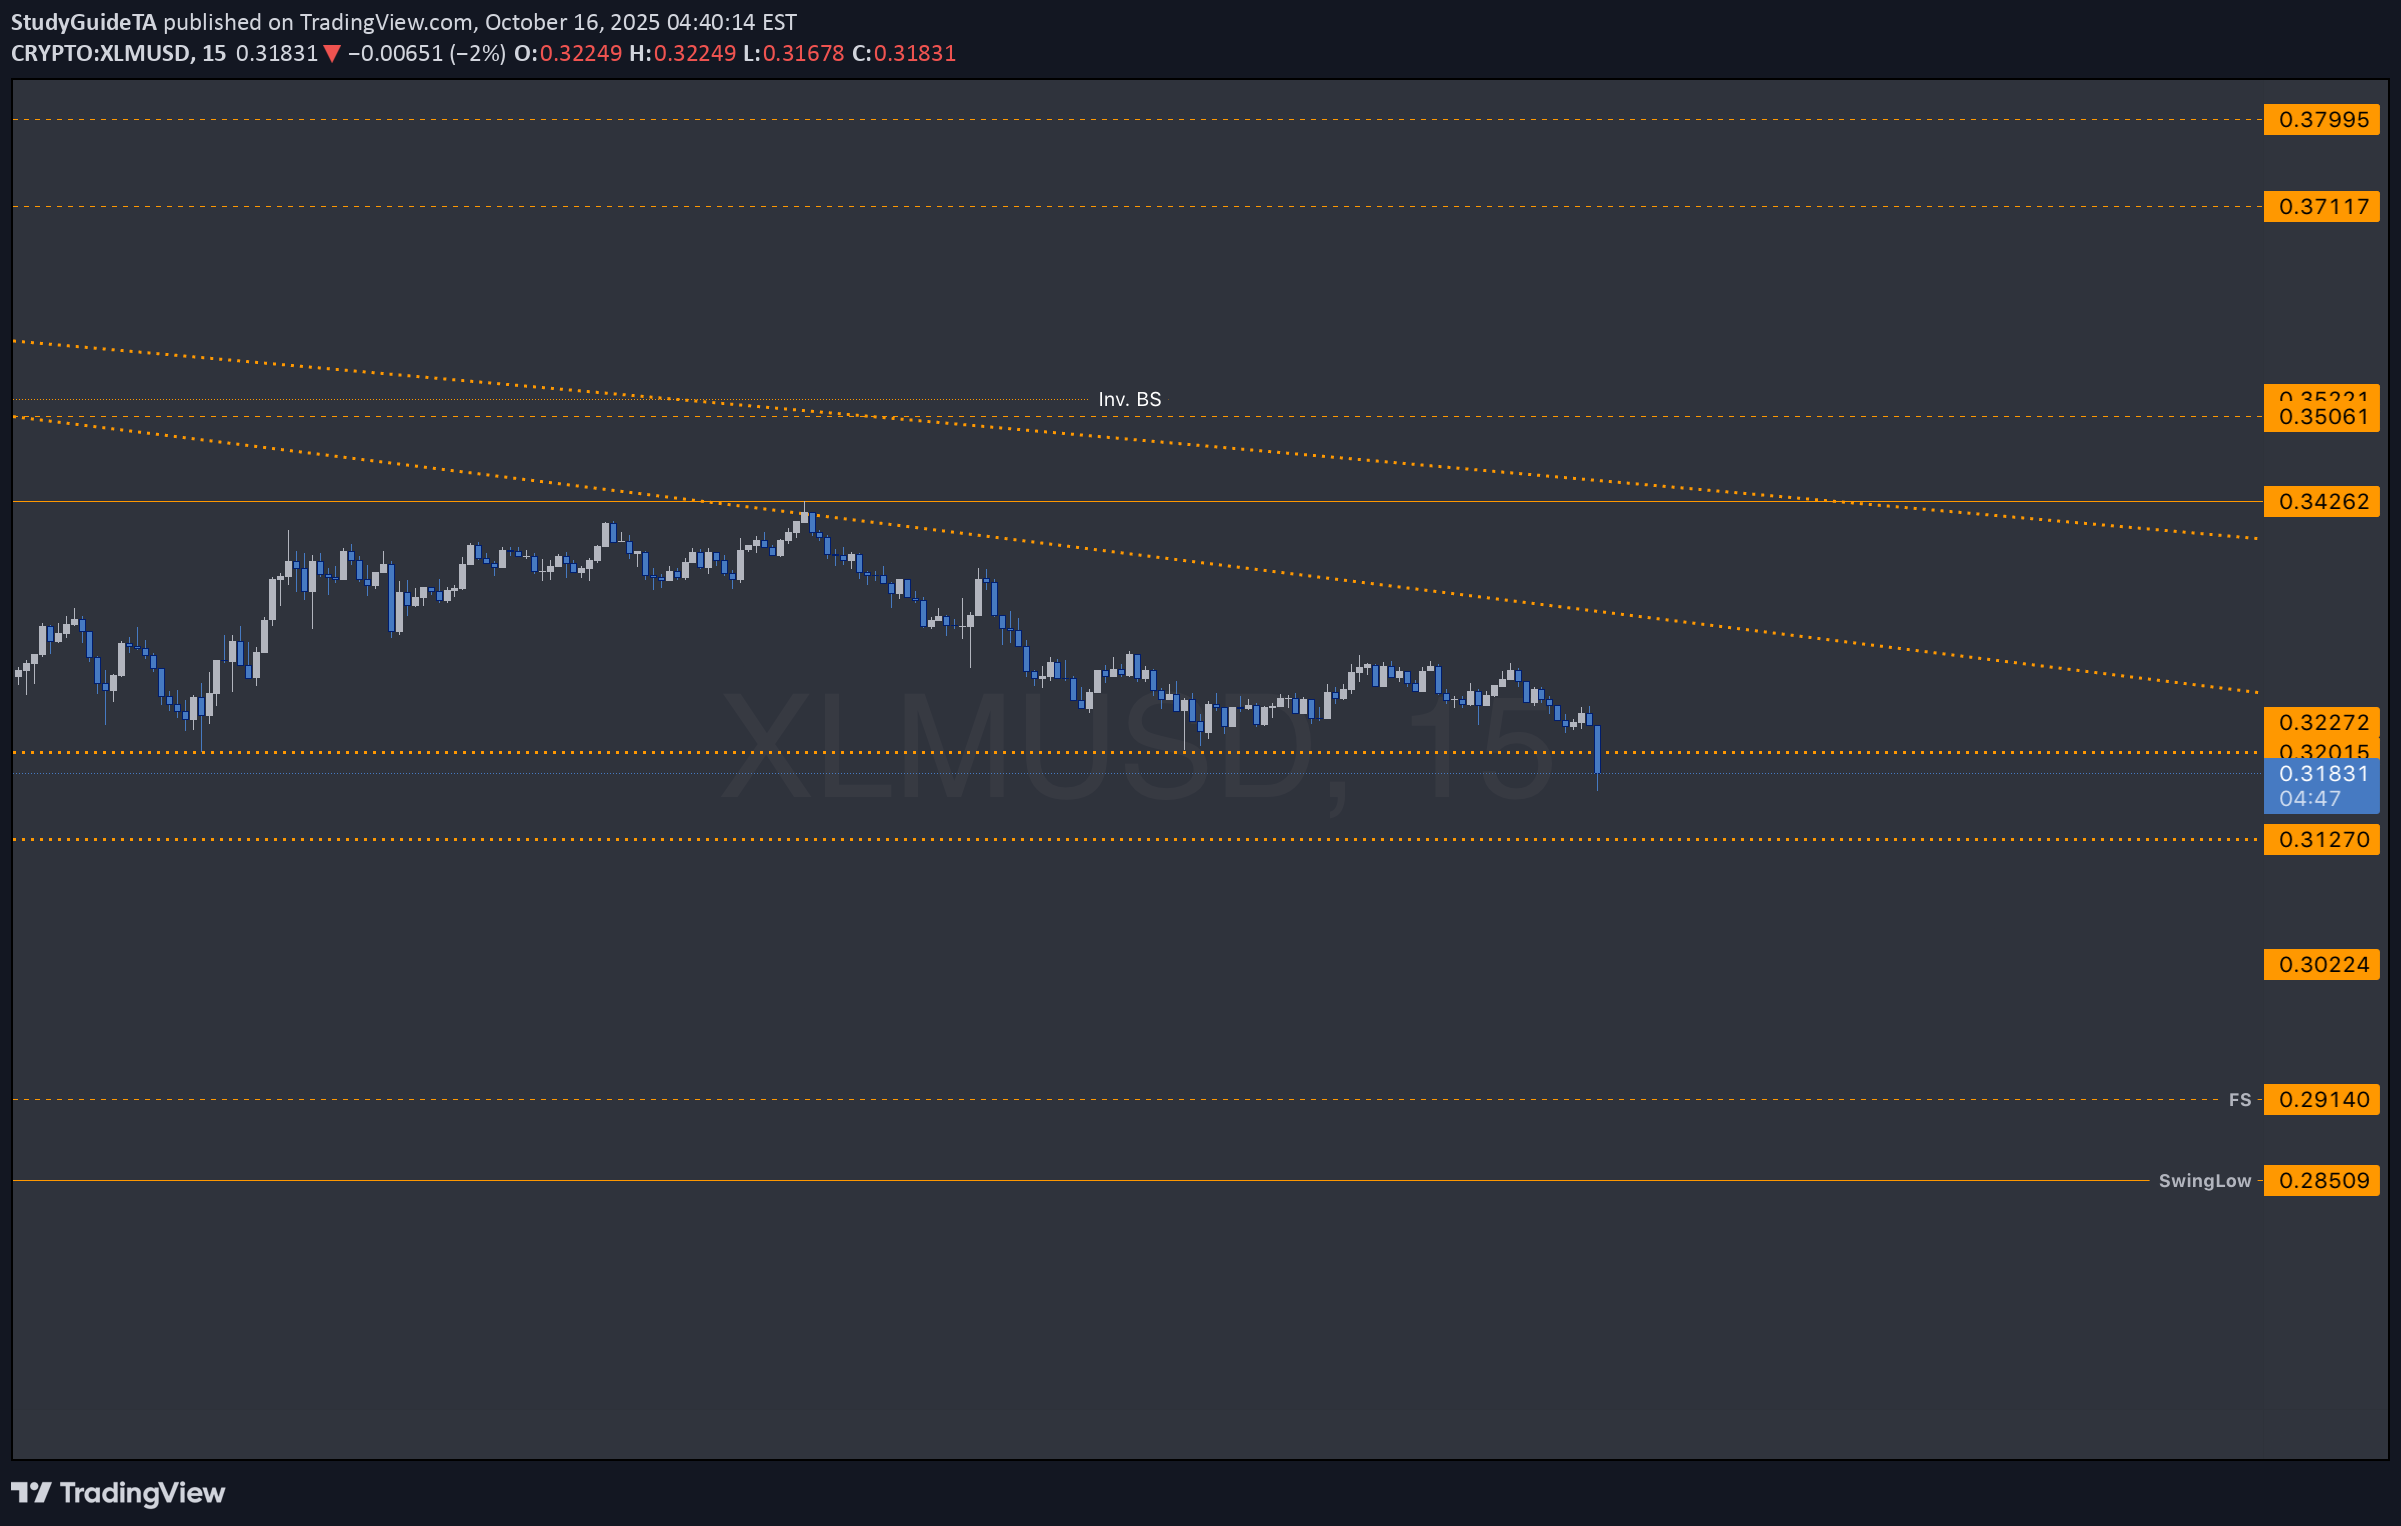
posted on the 15min timeframe. I wanted to see how price moved around the 4hour levels. If you know the 4 candles I look for and the 6 levels they create, then you can see the 15min ranges, and levels, using the mouse and arrow to align the levels during the replay to see what was tested, No need to mark the 15min levels when the eyes can be trained to see them.this chart is basically done. Thanks for following Those resistance levels above price are still active but will not be drawn over to the right far enough when price reaches them the chart won't be pretty and organized so its finished the week breaking out of the distribution trends and will likely use their resistance as levels of support now. like stomping on the heads of their oppressors. XLM marches on.