Technical analysis by F0rexBorex about Symbol PAXG on 10/11/2025

F0rexBorex
پیشبینی هفتگی طلا: سطوح حیاتی خرید و فروش برای هفته آینده
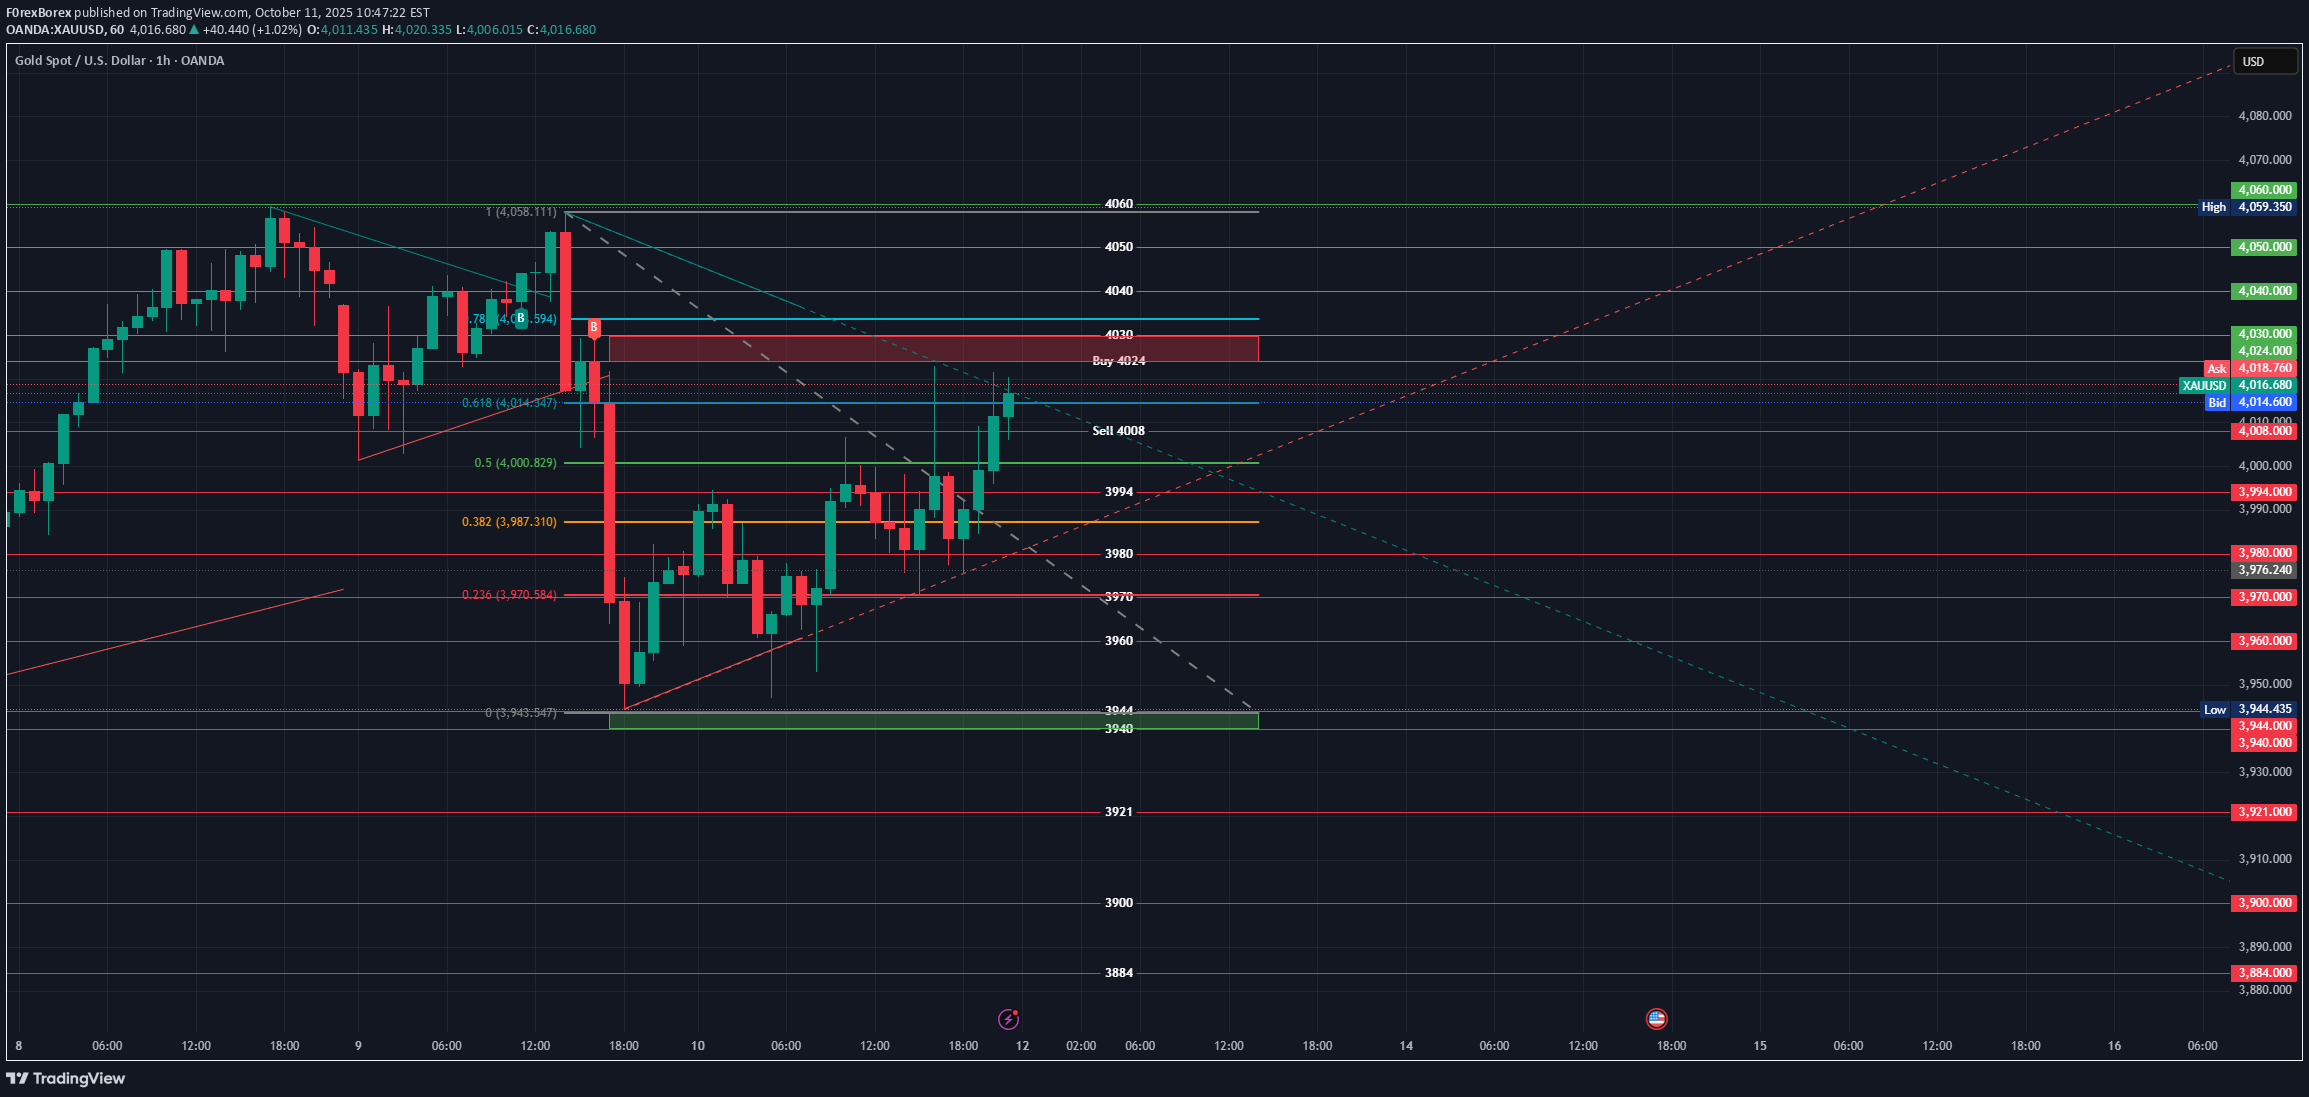
Las week was the 16th week in a row that we made a profit 1650 pips from entry full disclosure i closed at 600 pips This analysis is based on the provided 1-hour XAUUSD (Gold Spot / U.S. Dollar) chart, which shows price action up to approximately October 11, 2025, 16:40 UTC+1. The chart includes Fibonacci Retracement levels applied to a recent strong down move (from 4058.111 down to 3943.547) and identifies potential entry/exit zones. ## Current Market Context (1-Hour Timeframe) **Price Action:** The chart shows a significant price drop from a recent high of approximately $4,058, sharply correcting to a low around $3,943. Since hitting the low, the price has been recovering, and the recent candles show strong bullish momentum attempting to push through resistance levels related to the retracement. **Fibonacci Retracement:** The retracement is drawn from the swing high (1 or 100%) at **$4,058.111** down to the swing low (0 or 0%) at **$3,943.547**. The current price is hovering between the 50% and 61.8% retracement levels, fighting to hold above the 50% level. **Key Levels (Based on Fib Retracement):** | Fib. Level | Price (USD) | Significance | | :---: | :---: | :--- | | 100% (High) | $4,058.111 | Major resistance, swing high. | | 78.6% | $4,08.594 (Typo in OCR, likely $4,038.594 based on visual) | Strong resistance zone. | | **61.8%** | **$4,014.347** | **Crucial reversal/continuation level (Golden Ratio). The price is currently near this level.** | | **50.0%** | **$4,000.829** | **Psychological and technical midpoint ($\mathrm{$4,000}$).** | | 38.2% | $3,987.310 | Minor support after bounce. | | 23.6% | $3,970.584 | Minor support. | | 0% (Low) | $3,943.547 | Major support, swing low. | --- ## Buy Levels (Bullish Bias) A bullish scenario requires the current upward momentum to continue, breaking through the immediate resistance barriers. **1. Immediate Confirmation Buy (Aggressive/Trend Following):** * **Target Buy Zone:** **Above $4,024** (Marked as "Buy 4024" on the chart). * **Rationale:** This area lies just above the 61.8% Fibonacci level ($4,014.347) and likely represents a small resistance zone or previous pivot point. A decisive close above $4,024 signifies strong control by buyers and targets a move toward the 78.6% retracement. * **Potential Targets:** $4,038.594 (78.6% Fib), followed by $4,050 and the old high at $4,058.111. **2. Retracement Buy (Conservative/Pullback):** * **Target Buy Zone:** Near **$4,008** (Previous resistance/support area, near the 50% Fib or labeled Sell level). If the price holds above the 50% Fib ($4,000.829) after touching $4,024 and corrects back down. * **Rationale:** Buying the retest of the $4,000–$4,008 psychological and technical support region, confirming the breakout above the 50% level. --- ## Sell Levels (Bearish Bias) A bearish scenario involves the price failing to sustain the current rally and rejecting the key Fibonacci resistance levels, leading to a continuation of the prior downtrend. **1. Immediate Confirmation Sell:** * **Target Sell Zone:** **Below $4,008** (Marked as "Sell 4008" on the chart). * **Rationale:** Failure to hold the 61.8% Fib and a break below the $4,008 level (which is slightly above the $4,000 psychological level/50% Fib) would confirm a rejection of the recovery attempt. * **Potential Targets:** $3,994, $3,987.310 (38.2% Fib), and $3,970.584 (23.6% Fib). **2. Continuation Sell (Strong Breakdown):** * **Target Sell Zone:** A confirmed break and close below the **$4,000.00** psychological level, or specifically below the **38.2% Fib ($3,987.310)**. * **Rationale:** A move below $3,987 would indicate sellers are aggressively resuming control, likely targeting the low established at $3,943.547. --- ## Technical Outlook Summary | Scenario | Trigger | Immediate Resistance/Support | Key Target | | :--- | :--- | :--- | :--- | | **Bullish** | Sustained close **above $4,024**. | $4,038 (78.6% Fib) | $4,058 (Recent High) | | **Bearish** | Confirmed move **below $4,008** (and 61.8% Fib). | $4,000 (50% Fib Support) | $3,987 (38.2% Fib) / $3,943 (Swing Low) | $4,008 and $4,024 appear to be the crucial short-term flip zones determining the next major directional move on this 1-hour chart. The current price is consolidating just around the 61.8% retracement level, making the next few candles critical for confirming direction.Running 568 pips from the buy level1560 pips target reached trade closed