Technical analysis by GoldFxMinds about Symbol PAXG on 10/4/2025

GoldFxMinds
طلا در آستانه انفجار؛ کدام سطح تعیینکننده مسیر هفتگی است؟
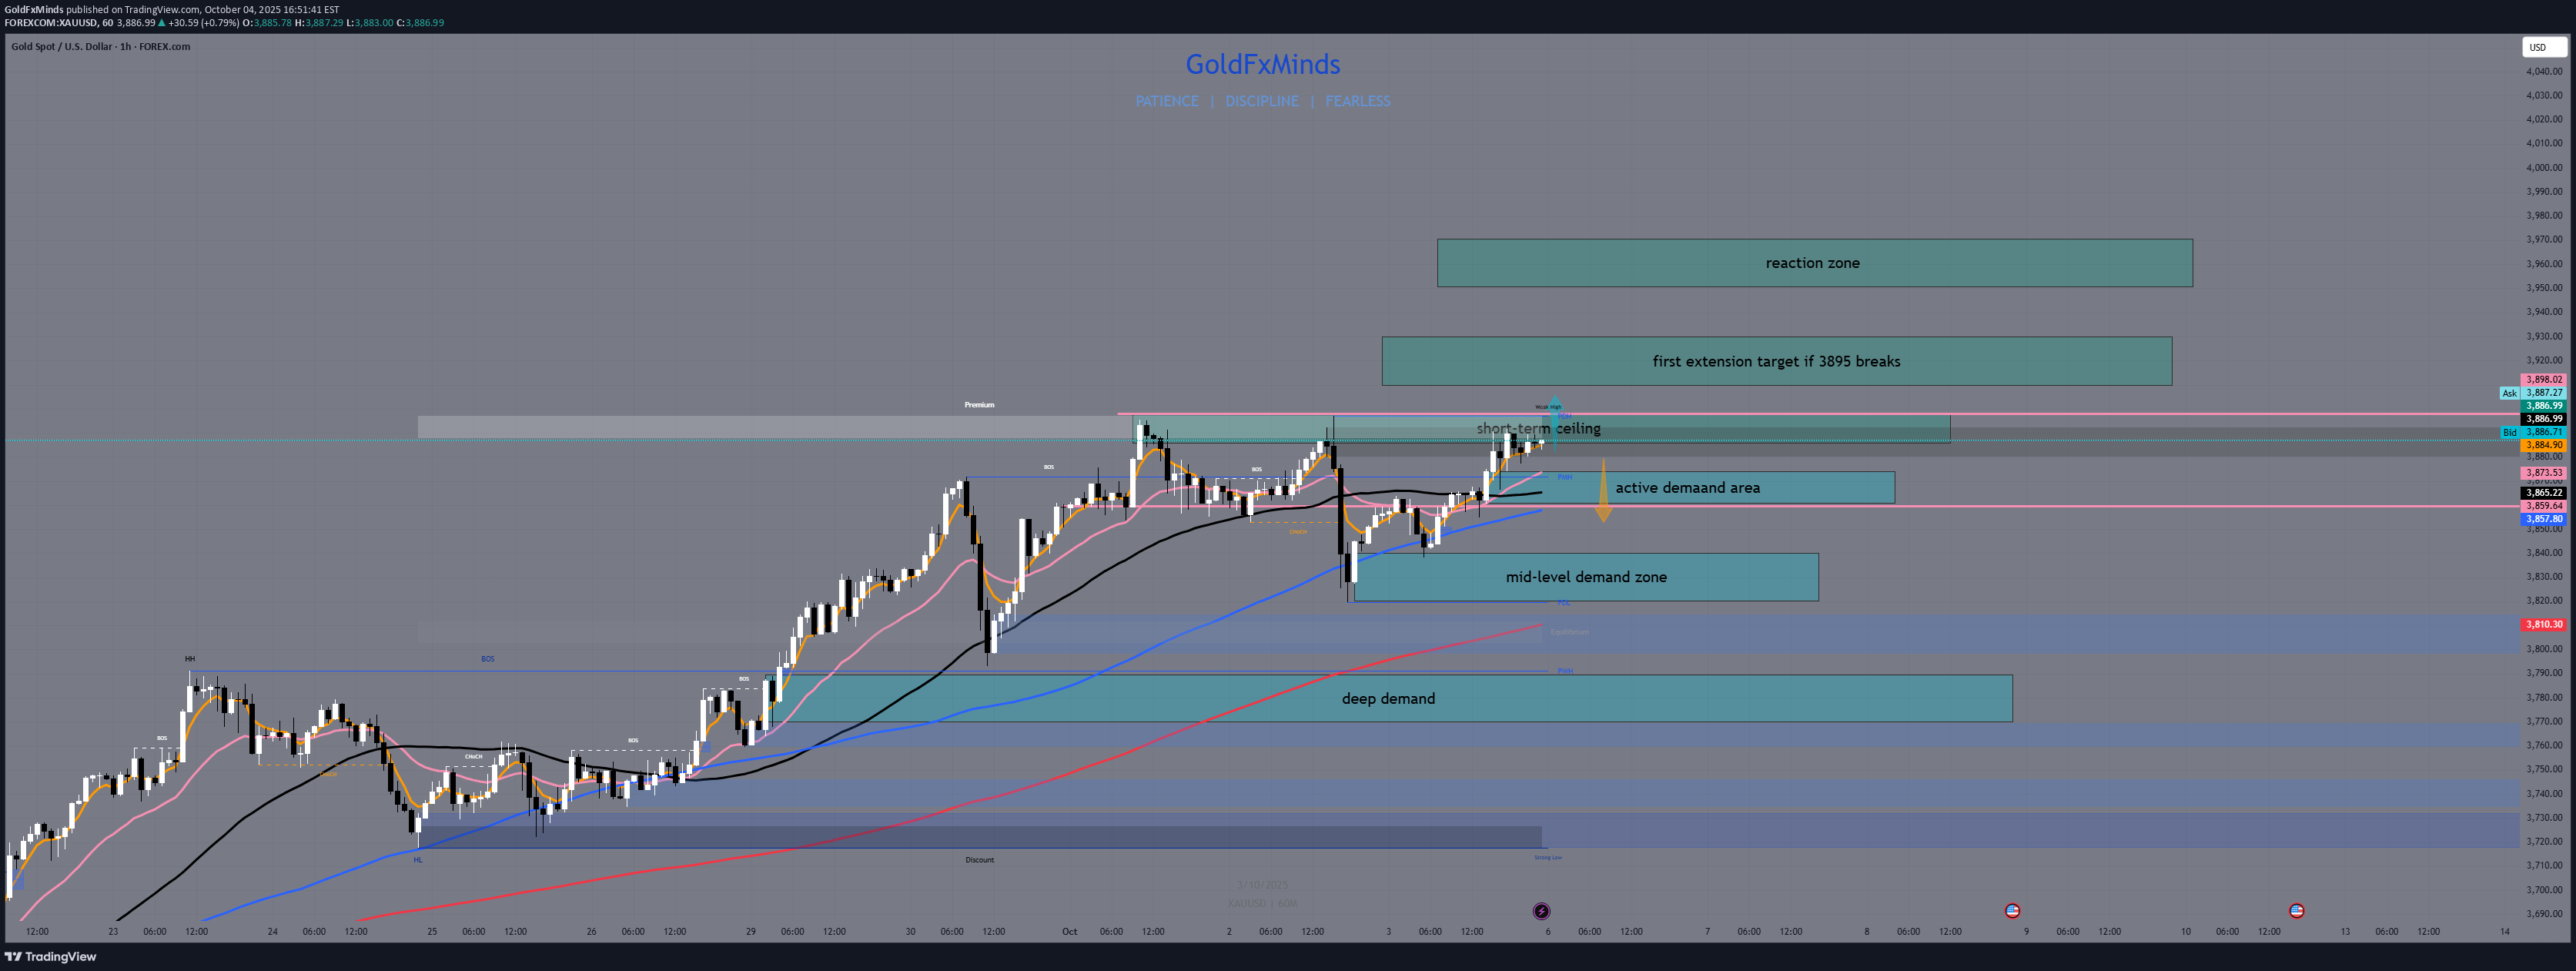
Gold trades inside compression, building energy for the next directional leg. This is the H1 Outlook for the upcoming week — a full structural forecast built exclusively from the H1 chart, mapping what price could do next if key levels break. Macro & Flow Context Next week brings heavy catalysts: Powell, multiple FOMC speeches, and NFP on Friday. Liquidity will be the key driver — gold is sitting under a thick ceiling after weeks of expansion, and the market is preparing for either a continuation squeeze or a weekly correction phase. All setups will form from this compression range. Bias — Bullish but near exhaustion The H1 structure remains in a controlled uptrend — higher lows, clean impulses, and shallow pullbacks. However, multiple rejections from 3,885–3,895 show momentum fading. Bulls still dominate, but control is fragile; any failed breakout could cascade into a multi-day retracement. 🟥 H1 Supply Zones 3,885 – 3,895 → Immediate Supply Zone The key short-term ceiling — market rejected this area multiple times. A breakout here will define the week’s bullish extension. 3,910 – 3,930 → Expansion Supply Zone The first target if 3,895 breaks clean — continuation range with thin structure above. 3,950 – 3,970 → Weekly Extension Supply Zone If gold expands, this becomes the exhaustion zone — where the next weekly reaction likely forms. 🟦 H1 Demand Zones 3,860 – 3,875 → Intraday Demand Zone Closest structural base — still holding control for buyers. A break below here opens retracement scope for the week. 3,820 – 3,840 → Mid-Level Demand Zone Previous re-accumulation zone — strong potential re-test area if volatility increases. 3,770 – 3,790 → Deep Demand Zone Weekly structure base — where the next wave could reload if correction develops further. Forecast Scenarios (Weekly Context on H1) Bullish Continuation Path If gold sustains above 3,860, bulls can attempt a clean breakout through 3,895 early in the week. That opens the path to 3,910–3,930, and if macro data stays soft, price could extend toward 3,950–3,970 — where exhaustion and possible weekly reaction are likely. A weekly close above 3,930 would confirm continuation into new premium territory. Bearish Correction Path If 3,885–3,895 holds as a cap and rejection repeats, gold may rotate downward, first into 3,860–3,875, then 3,820–3,840 as deeper structure gets tested. If the lower pocket breaks, the correction could unfold toward 3,770–3,790, where a larger re-accumulation base for the next bullish leg could form. A weekly close below 3,820 would confirm correction bias for the next sessions. Targets (Weekly Forecast from H1) Upside Zones: 3,910–3,930 → 3,950–3,970 Downside Zones: 3,820–3,840 → 3,770–3,790 Conclusion The H1 chart shows a market on the edge — bulls still hold structure, but pressure is visible. The range between 3,860 and 3,895 is the tactical line for the week ahead: break above, and gold expands; fail again, and correction unfolds. Next week’s tone will be set by how price reacts inside this narrow compression pocket. Price always whispers before it moves — the structure tells the truth. That’s not luck, it’s discipline and timing. Follow, like and comment if you map the move before it happens ⚡old — From Pressure to Breakout In the first chart, Gold was still compressed under the short-term ceiling, hovering around 3895–3910, while liquidity built quietly below. Momentum was trapped — demand layers were clean, but buyers weren’t ready to engage yet. In the new chart, that same structure unfolded perfectly: ✅ The active demand area (3895–3910) held like a wall. ✅ Price expanded straight into the reaction zone (3975–3990), where liquidity is now being absorbed. We’ve moved from pressure to confirmation — the short-term ceiling became the launch pad. Now, the battlefield is 3980–3993: → Stay below → pullback toward 3960–3948. → Break and hold above → liquidity extends to 4000–4015. Gold is not chasing — it’s collecting. Every dip tells the story of continuation. 🔥 Premium flow: precise, patient, and unfolding exactly as planned. Follow GoldFxMinds for the next tactical shift 🚀