Technical analysis by Hamza_Gold about Symbol ETH: Sell recommendation (4 hour ago)

بازار اتریوم در آستانه چرخش خرسی آیا مقاومت آبی قیمت را به پایین میکشد؟
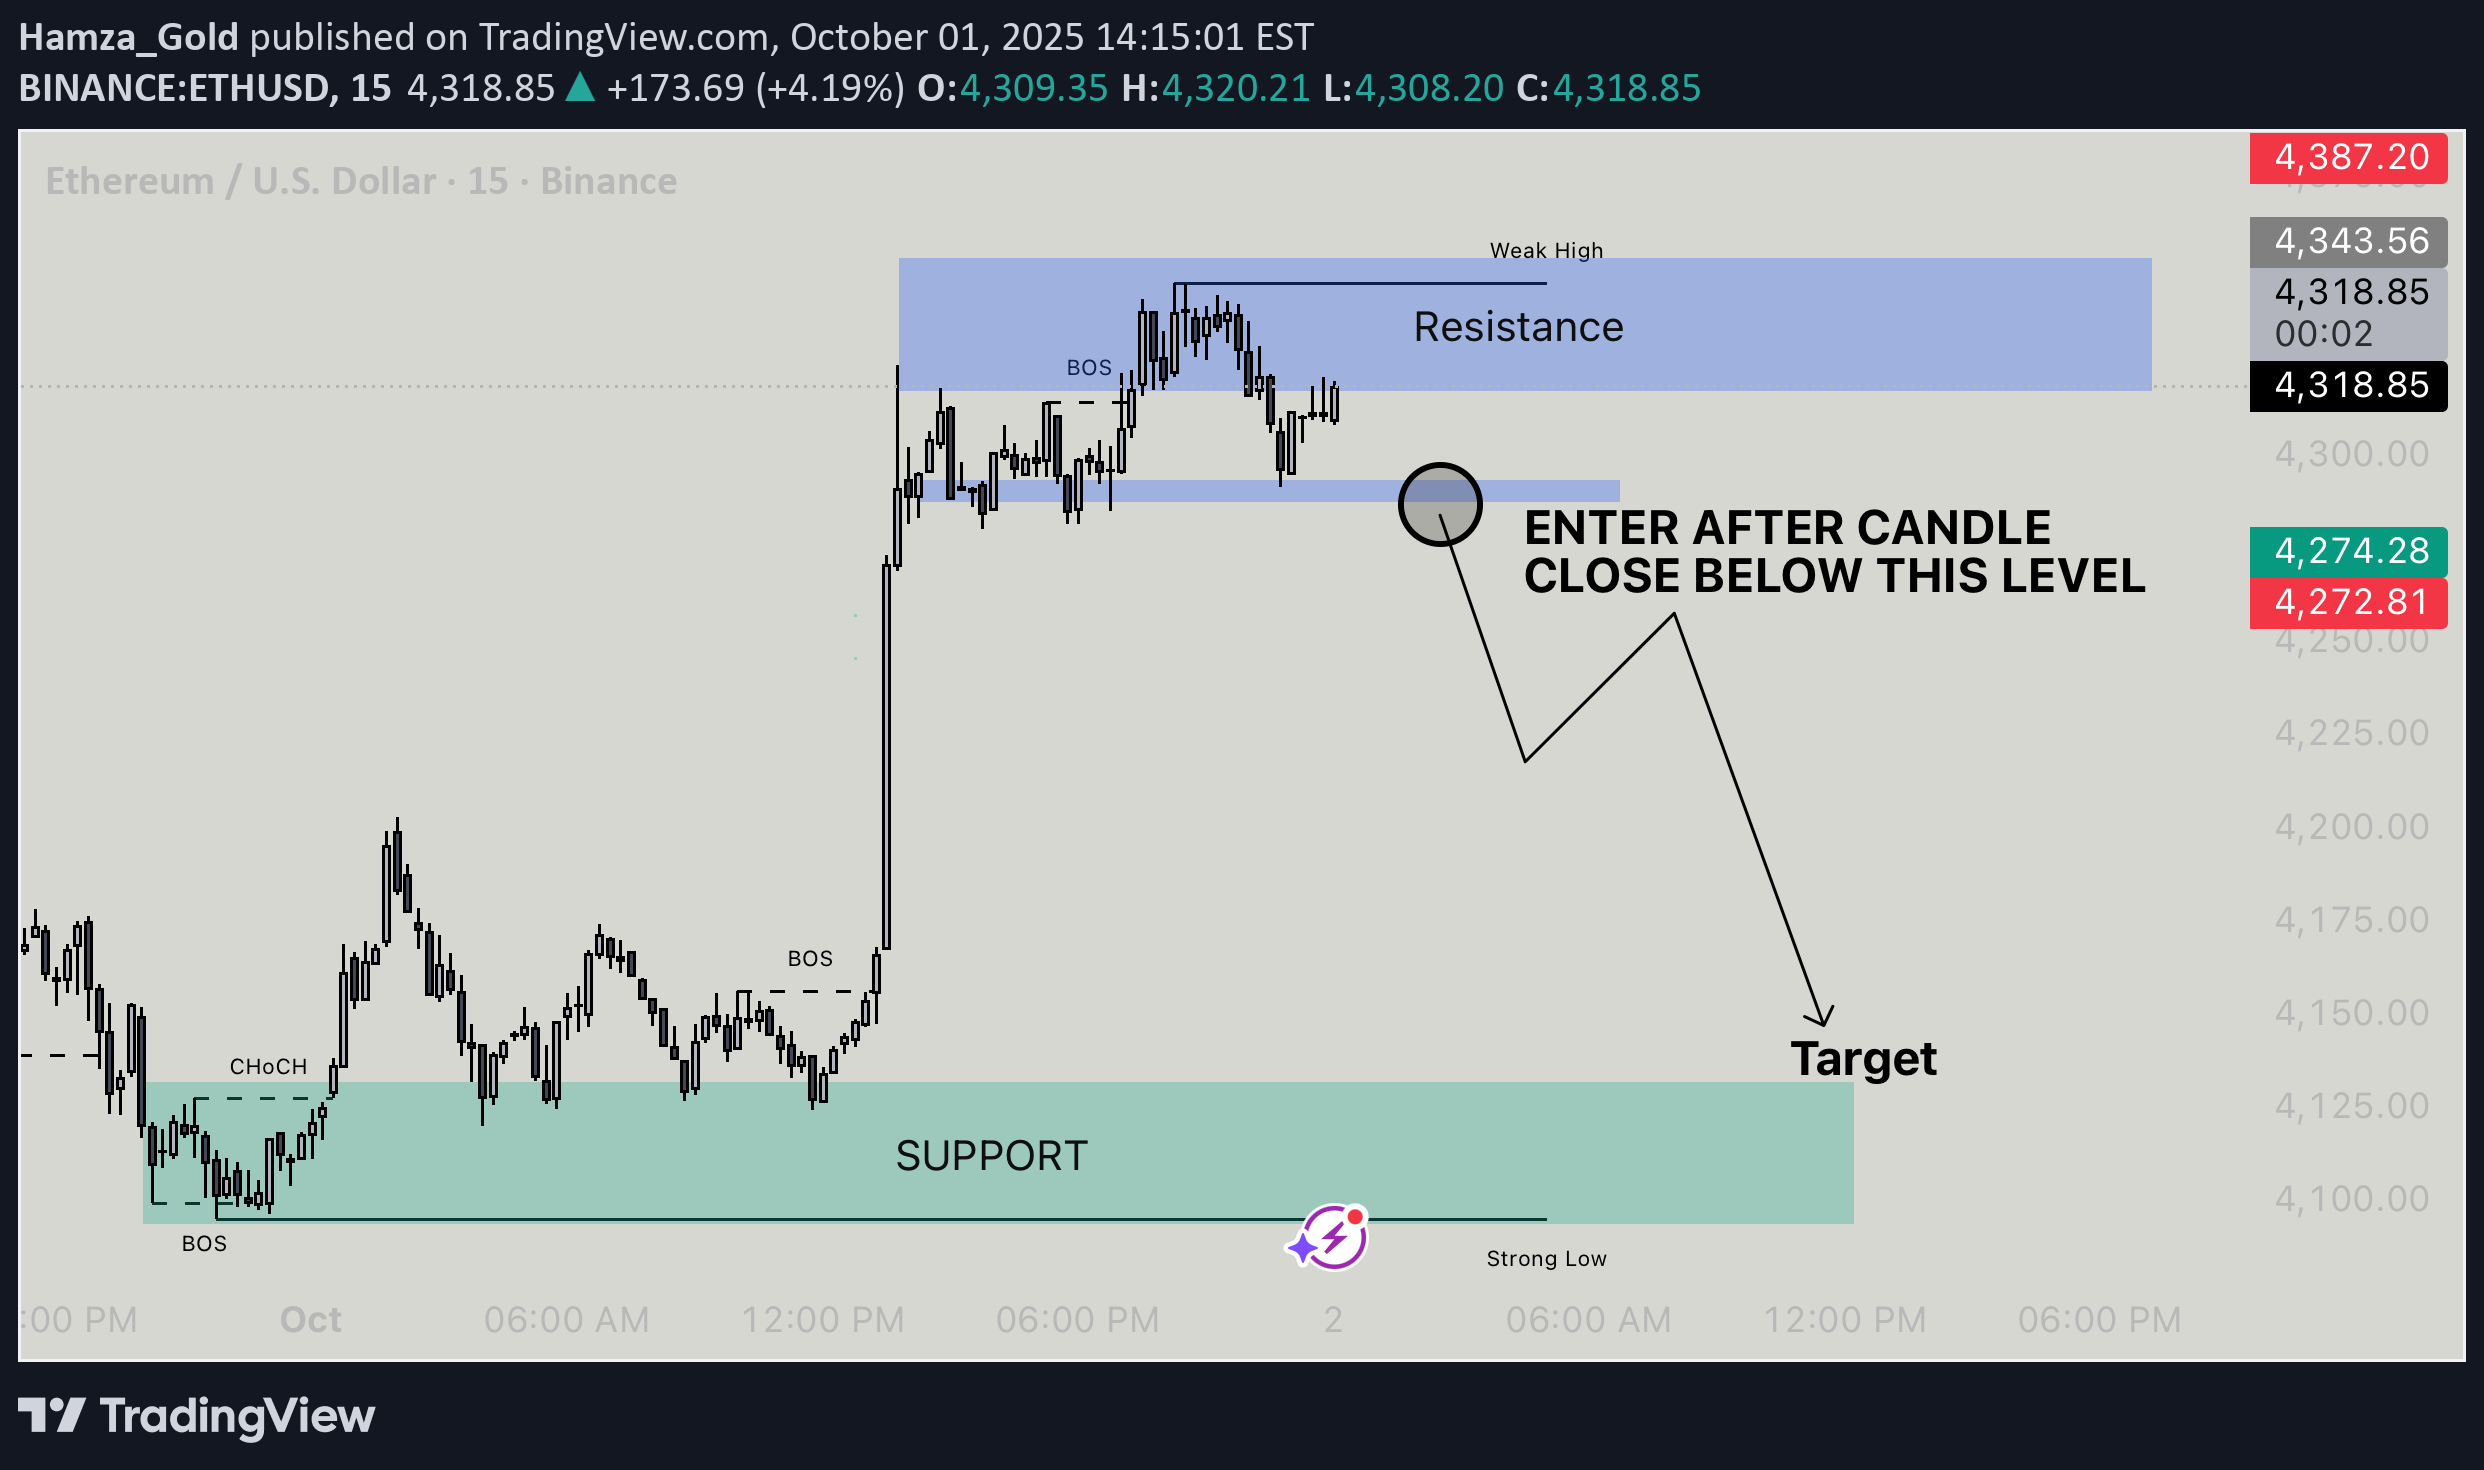
This chart shows the recent price movement of Ethereum (ETH) against the U.S. Dollar on the 15-minute timeframe. The market initially found strong support in the green zone at the bottom, where price reversed and started moving upwards. This area marked the beginning of a bullish trend, confirmed by breaks of structure (BOS) and a change of character (CHoCH)—indicating a shift from bearish to bullish momentum. Following this, ETH made a strong bullish move, breaking past previous highs and entering a resistance zone marked in blue. However, once price entered this resistance area, it began to slow down and form what is labeled a “Weak High”, meaning buyers were losing strength and struggling to push price higher. The chart highlights a potential short trade setup: If a candle closes below the marked support level just under the resistance zone, it would suggest the start of a bearish move. In that case, the suggested trade is to enter a short position and aim for the lower support area (target zone) where the price may again find demand. This setup reflects a possible trend reversal from bullish to bearish in the short term, especially if price fails to maintain above the resistance and breaks the nearby support.