Technical analysis by Crypto-Adda_Official about Symbol ETH: Buy recommendation (9/25/2025)

Crypto-Adda_Official
$ETH shows bullish hidden RSI divergence.
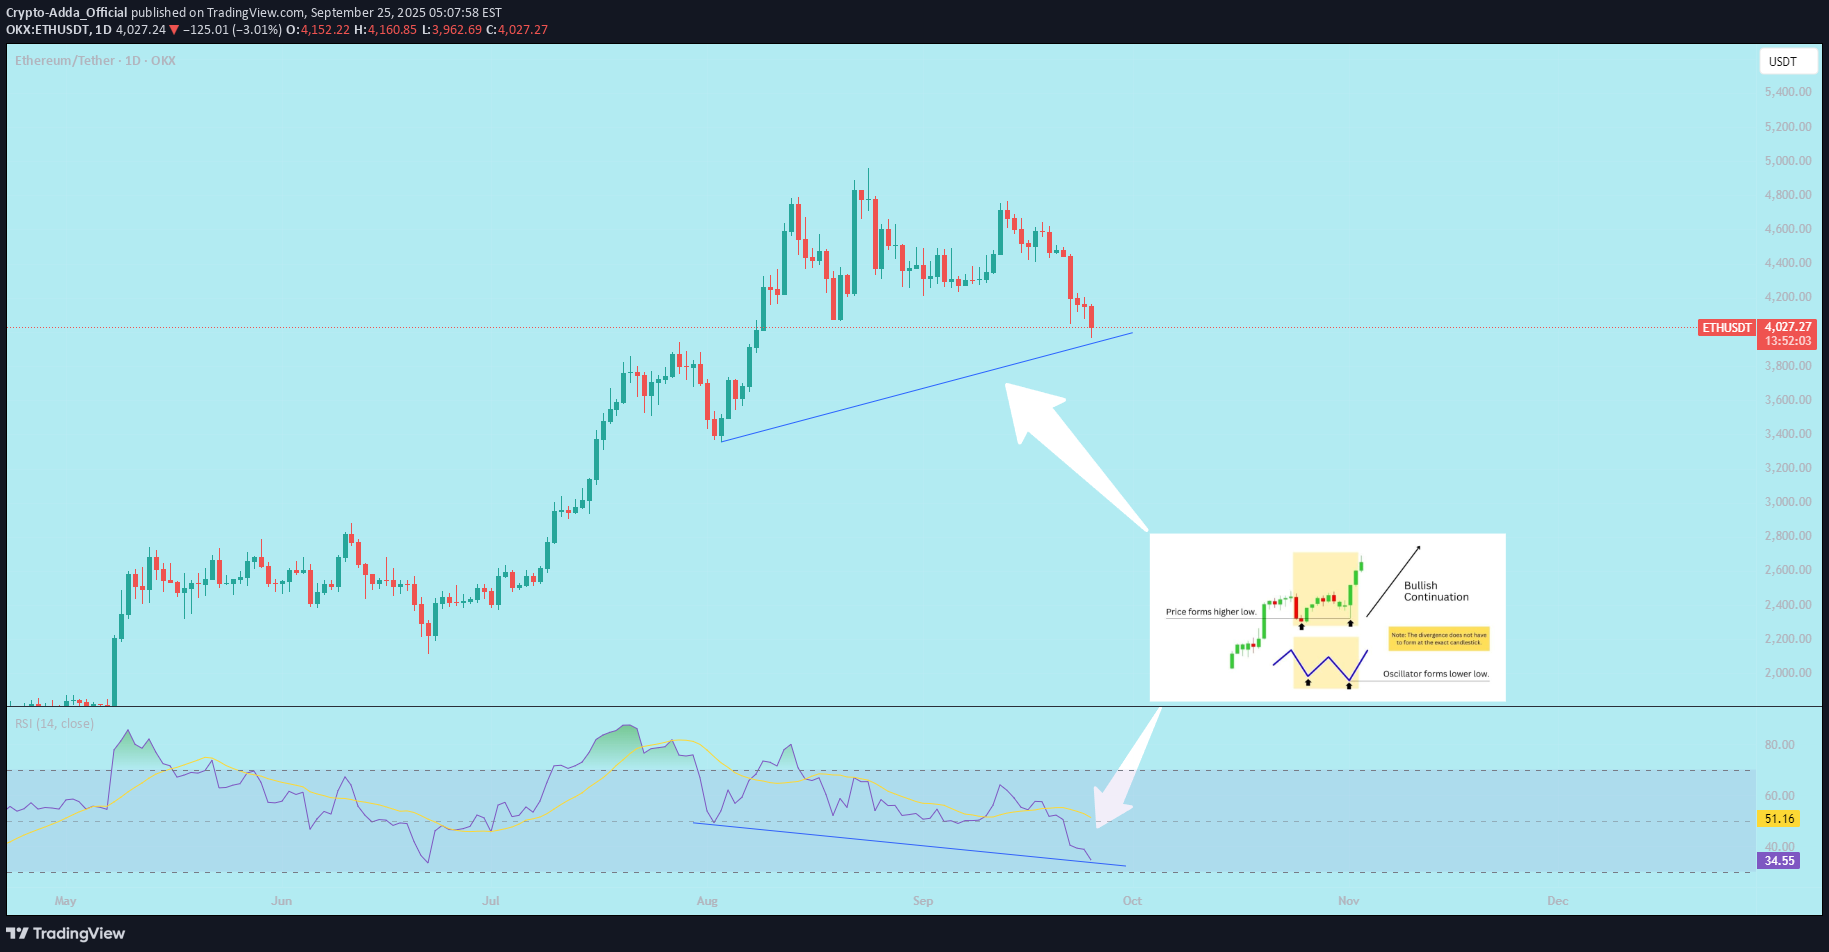
A **bullish hidden RSI divergence** is a trading signal that suggests a continuation of an upward trend, often indicating that the price will keep rising. It occurs when the price action and the Relative Strength Index (RSI) show a specific pattern. Here's a simple explanation of how to identify and trade it: ### Step 1: Understand the Pattern - **Price Action**: The price makes **higher lows** (each low point is higher than the previous one), indicating an uptrend. - **RSI**: The RSI makes **lower lows** (the RSI is declining while the price is not), showing a divergence from the price trend. - This mismatch suggests that the uptrend is still strong, and the dip in RSI is just a temporary slowdown in momentum, not a reversal. ### Step 2: Identify the Divergence 1. **Chart Setup**: Use a price chart (e.g., candlestick chart) with the RSI indicator (typically set to 14 periods) on a platform like TradingView . 2. **Spot Higher Lows in Price**: Look for a price chart where the recent low is higher than the previous low (e.g., $100 to $105). 3. **Check RSI for Lower Lows**: At the same time, check if the RSI is making a lower low (e.g., RSI drops from 50 to 45 while price makes a higher low). 4. **Confirm the Uptrend**: Ensure the overall trend is bullish (price is generally moving up with higher highs and higher lows). ### Step 3: Trading the Bullish Hidden RSI Divergence 1. **Entry Point**: - Enter a **buy** trade when you confirm the divergence and see the price starting to rise again after the higher low. - Look for additional confirmation, like a bullish candlestick pattern (e.g., a hammer or engulfing candle) or a break above a resistance level. 2. **Stop Loss**: - Place a stop loss below the most recent higher low to protect against a potential trend reversal. - For example, if the higher low is at $105, set the stop loss slightly below, like $103. 3. **Take Profit**: - Target a take-profit level based on previous highs, support/resistance levels, or a risk-reward ratio (e.g., 1:2, meaning you aim for twice the profit compared to your risk). - For instance, if your stop loss is $2 below entry, aim for a $4 profit target. ### Step 4: Manage the Trade - **Monitor RSI**: Ensure RSI doesn’t drop into oversold territory (below 30) or show signs of a bearish reversal. - **Adjust Stop Loss**: As the price moves up, consider trailing your stop loss to lock in profits. - **Exit Strategy**: Exit the trade if the price hits your target, or if you see signs of a trend reversal (e.g., a bearish divergence or break of key support). ### Example - **Price**: Stock XYZ makes a low at $100, then a higher low at $105. - **RSI**: RSI drops from 50 to 45 during the same period. - **Action**: You enter a buy trade at $106 after a bullish candle. Set a stop loss at $103 and aim for a take-profit at $110 (1:2 risk-reward). - **Outcome**: If the price continues its uptrend to $110, you take profit. If it drops below $103, you exit with a small loss. ### Tips - **Timeframes**: Use higher timeframes (e.g., 1-hour, 4-hour, or daily) for more reliable signals. - **Confirmation Tools**: Combine with other indicators like moving averages or trendlines for stronger signals. - **Practice**: Test this strategy on a demo account before using real money to understand how it works in different market conditions. - **Risk Management**: Never risk more than 1-2% of your trading account on a single trade. This strategy works best in trending markets, so always confirm the broader trend before trading.