Technical analysis by behdark about Symbol XCN on 9/18/2025

behdark
XCN Analysis (12H)
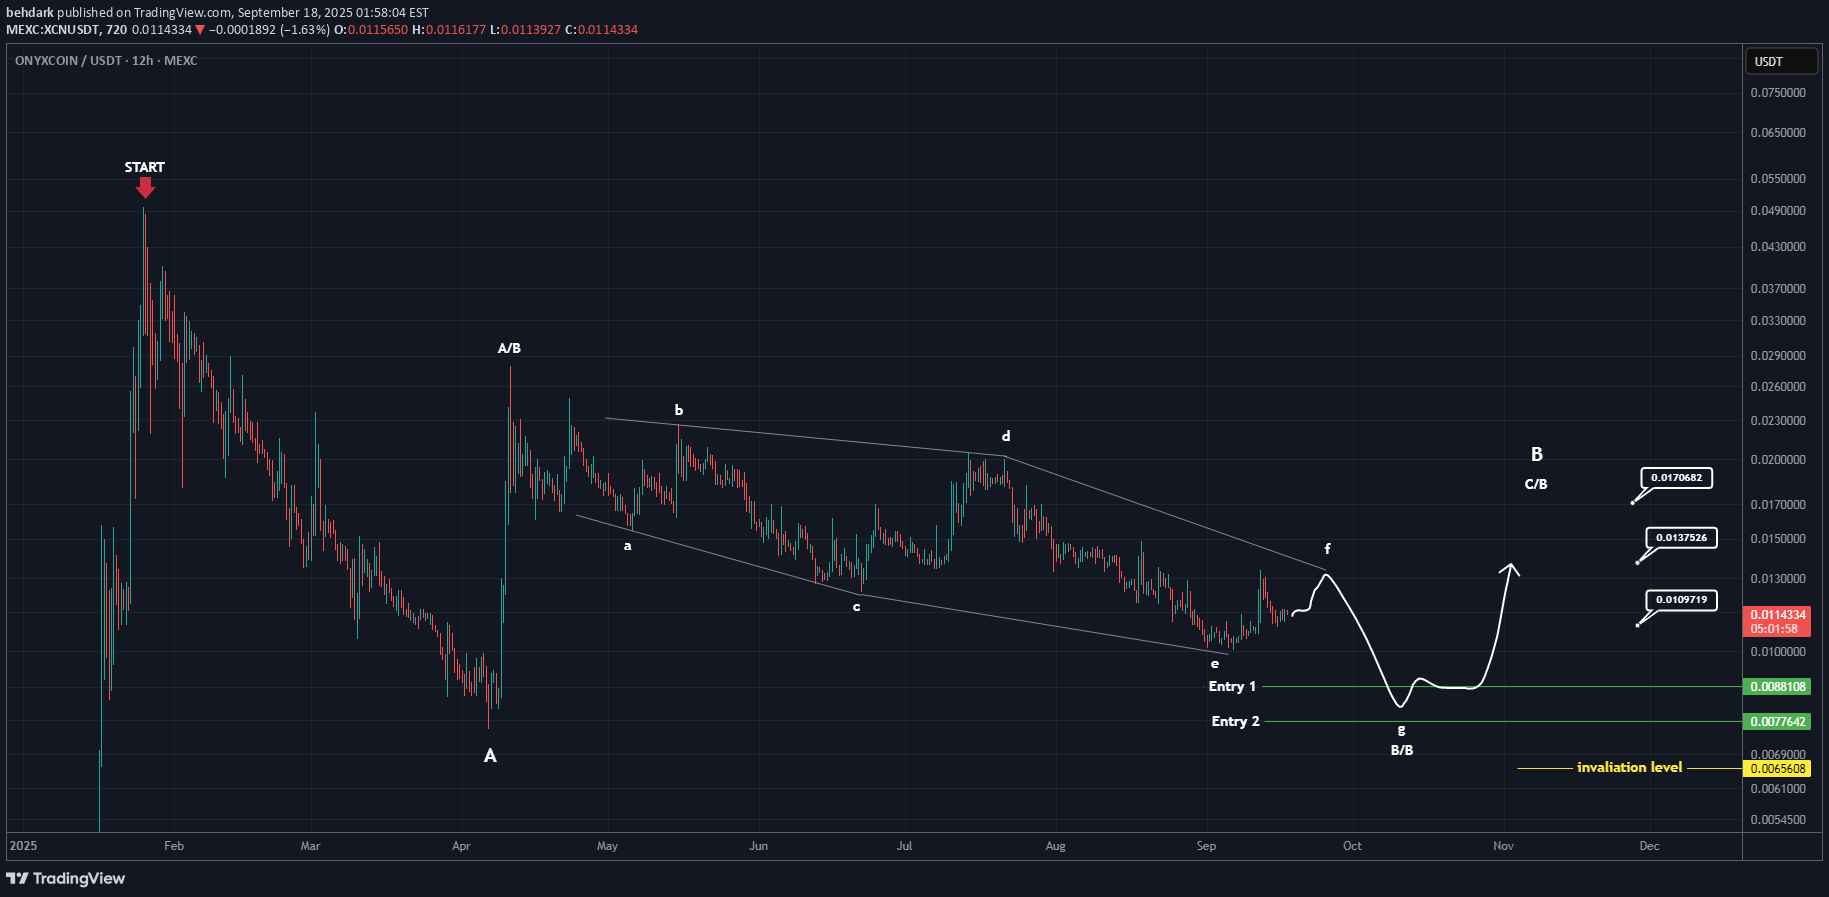
From the point marked START on the chart, the correction of XCN seems to have begun. Based on the wave structure, the price now appears to be in a complex ABC. Wave B of B looks like a diametric, and we are currently in the middle of wave F. Once wave g of this diametric is completed, we can enter a position within the green zones, which represent our entry areas. ⚠️ Note that this asset is risky and highly volatile, so make sure to enter only in spot with proper risk management. The closing of a daily candle below the invalidation level will invalidate this analysis. For risk management, please don't forget stop loss and capital management When we reach the first target, save some profit and then change the stop to entry Comment if you have any questions Thank YouNot much time has passed since the analysis, and the price has pumped more than 16% to complete wave F. When wave G reaches our entry zones, only buying is allowed.After completing wave F, the price dropped more than 49%, but despite the market crash, it did not reach our invalidation level and found support. It is now over 20% in profit from Entry 1 and has pumped significantly. Due to the abnormal market conditions, Take some profits and manage your risk accordingly.