Technical analysis by cryptodailyuk about Symbol ETC on 9/17/2025

cryptodailyuk
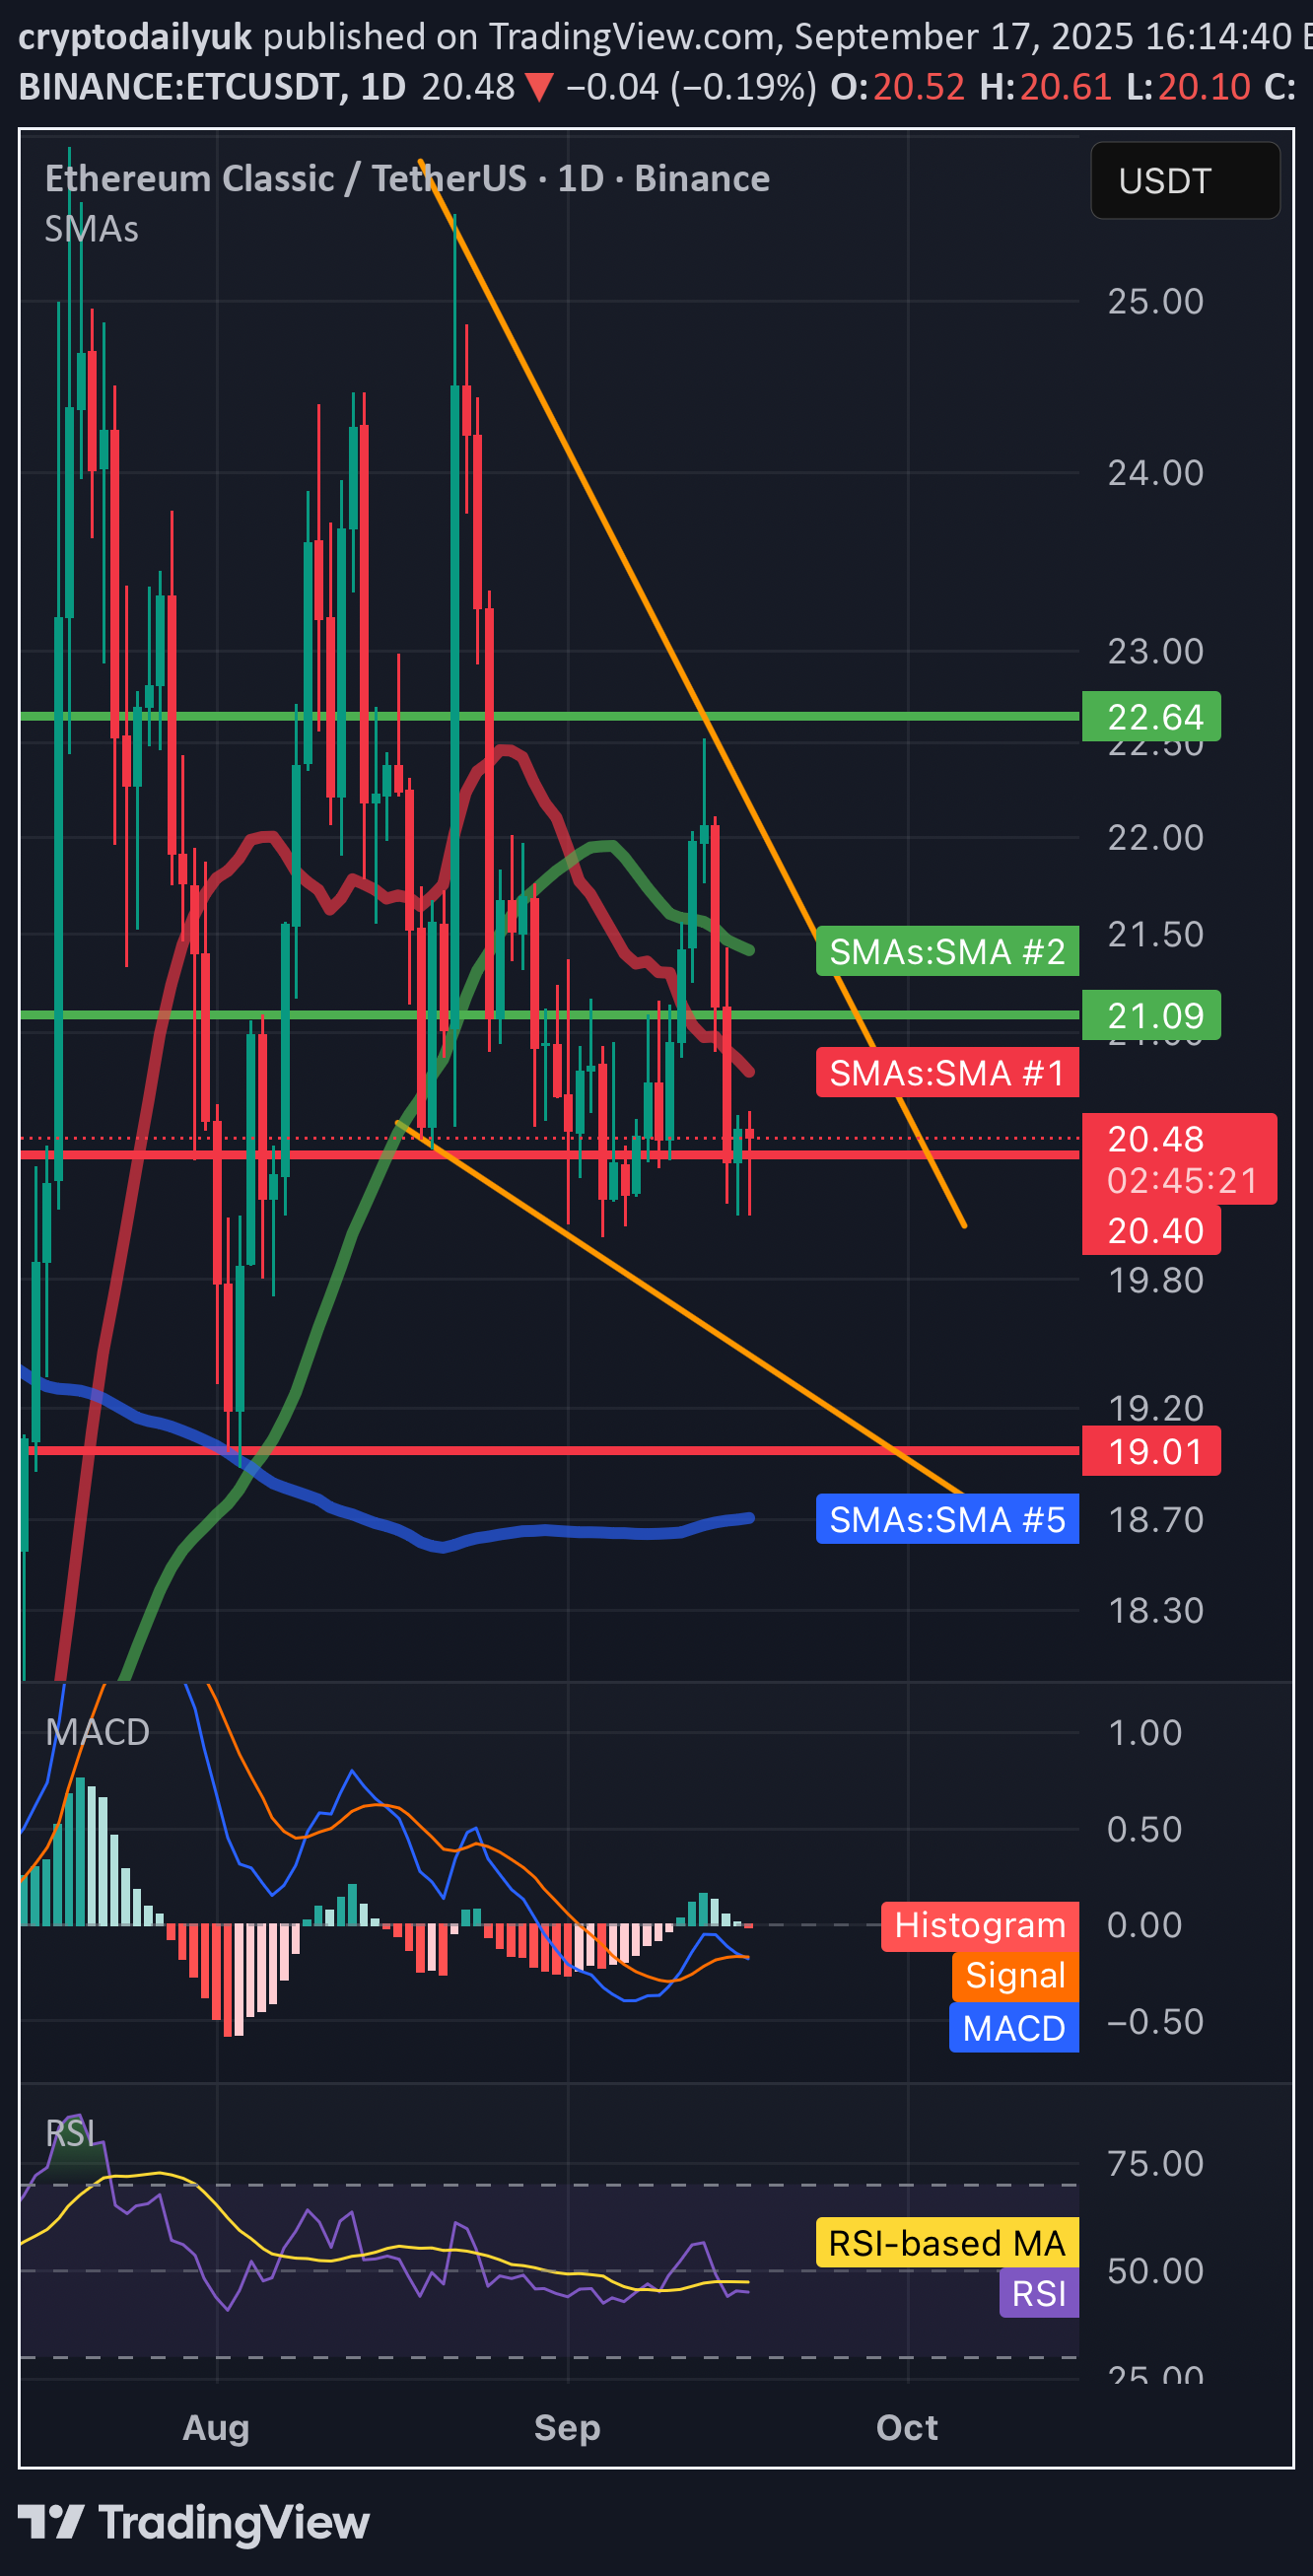
Trend and structure • The price is currently in the 20.40 USDT area. • You can see the downward trend line (orange), from which the price was rejected several times. • The next support: • 20.40 USDT (local, just tested) • 19.01 USDT (stronger support from earlier holes). • The nearest resistance: • 21.09 USDT (SMA + local level) • 22.64 USDT (strong resistance, last peak before fall). Medium walking • SMA (red/green lines) show that the short -term price is below most of the average → supply advantage. • Only breaking above 21.1–22.6 USDT could change the fondness for more bullfinches. MacD • The histogram grows slightly up (less red), but MacD lines and signal are close to each other → no clear trend, rather consolidation with slight relegation. RSI • RSI around 45–50, i.e. neutral. • There is neither a sale (<30) nor purchase (> 70). ⸻ 📊 scenario • bull: If ETC persists above 20.40 and boots over 21.1 USDT, it is possible to move in the direction of 22.6 USDT (main barrier). • Bear: If the price drops below 20.4 USDT, another goal is 19.0 USDT. Punction of 19 could open the road even towards 18-17.5 USDT.
