Technical analysis by readCrypto about Symbol ETH on 13 hour ago

readCrypto
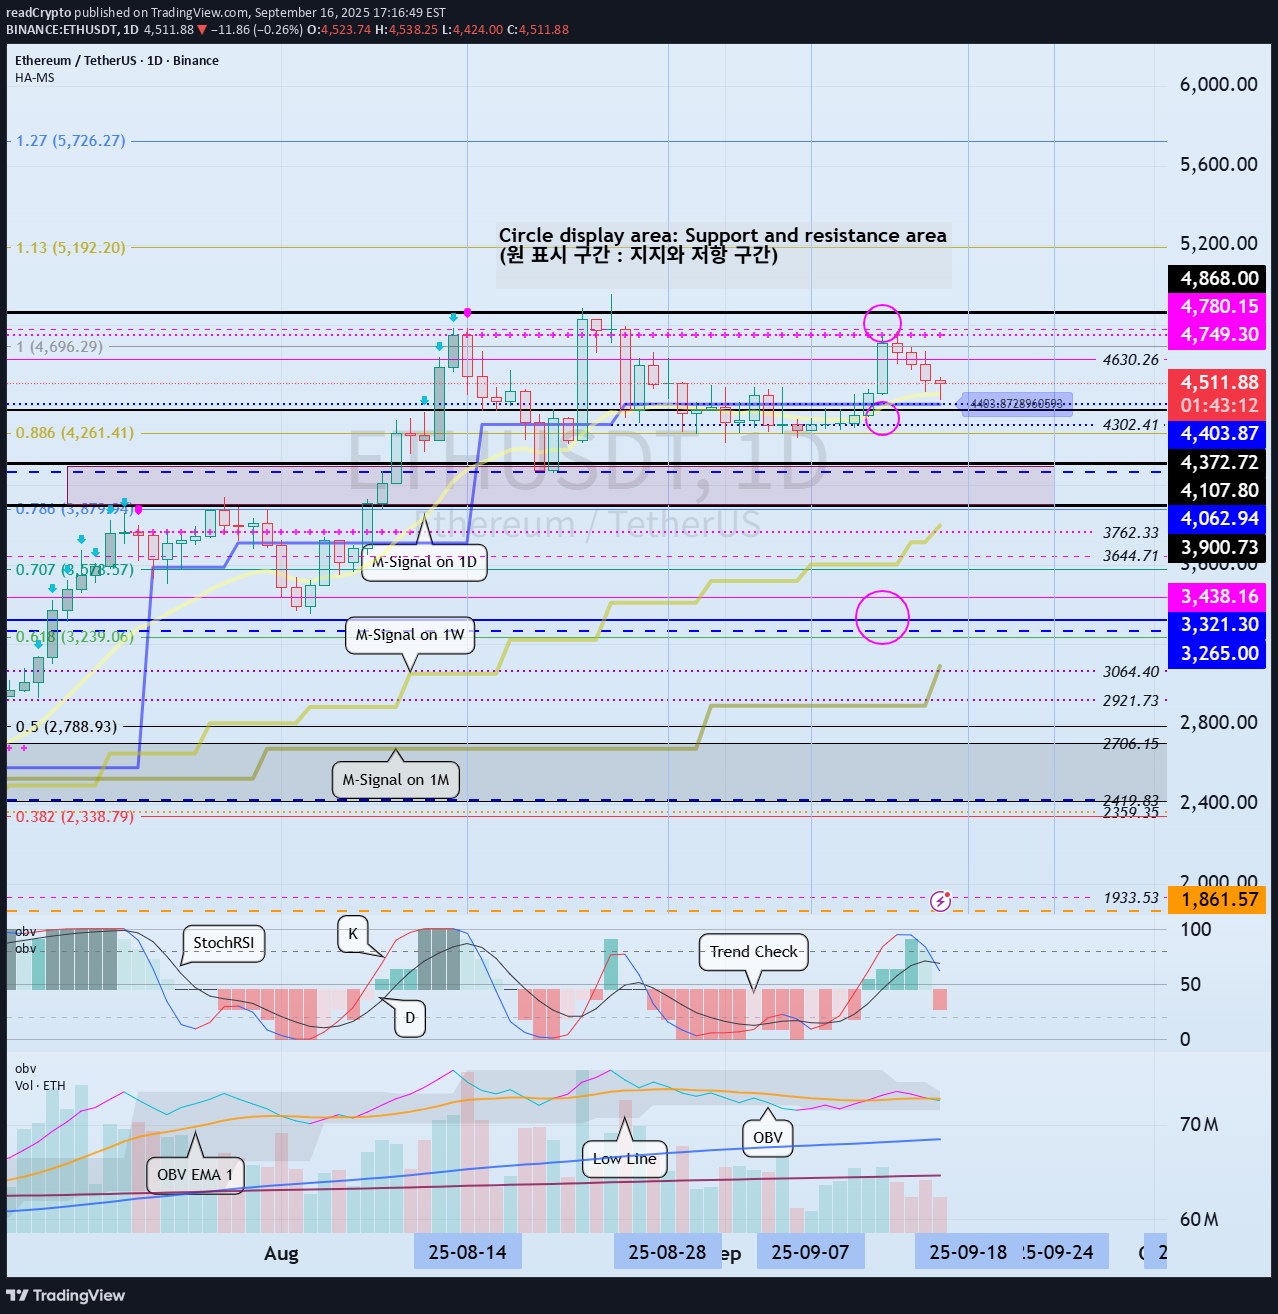
Hello, fellow traders! Follow us to get the latest information quickly. Have a great day! ------------------------------------- (ETHUSDT 1D Chart) The 4403.87-4749.30 range, which is the HA-High ~ DOM (60) range, represents a resistance zone. Therefore, we need to monitor the price movement after the current volatility period, around September 18 (September 17-19). To sustain the uptrend, the price must remain above the 3900.73-4107.80 range. From a medium- to long-term perspective, the 3265.0-3321.30 range is a key area. Considering the above, if it falls below 4403.87, 1st: 4107.80-4372.72 2nd: 3265.0-3321.30 Therefore, it is likely to fall to the first and second levels above. Therefore, the key question is whether it can find support near 4403.87 after this period of volatility. - When trading, it's important to understand the current price level. I believe there are several ways to determine this. My basic trading strategy is to determine when to trade. My basic trading strategy is to buy when support is found in the DOM(-60) ~ HA-Low range and rise, and to sell when it touches the HA-High ~ DOM(60) range. However, if the price rises in the HA-High ~ DOM(60) range, a step-like upward trend is likely, while if it falls in the DOM(-60) ~ HA-Low range, a step-like downward trend is likely. Therefore, the basic trading strategy should be a segmented trading strategy. If you were unable to buy in the DOM(-60) ~ HA-Low range, but the current price is within the DOM(-60) ~ HA-Low range, you should check for support. Support is determined by checking whether support is found near the HA-Low or DOM(60) indicators. If you bought when support was found near the HA-Low indicator, the first sell position would be near the DOM(60) indicator. If you bought when support was found near the DOM(60) indicator, you should execute the trade quickly and effectively. If the price falls below the purchase price, it would be considered a buy at the high. To prevent this to some extent, we've utilized several indicators for verification. First, we utilize the M-Signal indicator on the 1M, 1W, and 1D charts. That is, if the M-Signal indicator is passing near important support and resistance levels, the presence of support in that area is likely to play a more important role. Currently, the M-Signal indicator on the 1D chart is passing near 4403.87, so we should consider the area around 4403.87 as a potential important support and resistance level. Second, we should monitor the movements of auxiliary indicators such as the TC (Trend Check) indicator, the StochRSI indicator, and the On-By-Signal (OBV) indicator. For the price to continue its upward trend in this important support area, - the StochRSI indicator must show an upward trend. If possible, it's best to avoid entering the overbought zone. - The OBV indicator should be showing an upward trend. If possible, it should remain above the High Line. - The TC (Trend Check) indicator should be showing an upward trend. If possible, it should remain above the 0 level. By monitoring the movements of the three indicators above, you can determine whether there is support near important support and resistance levels. However, you should not blindly trust the movements of auxiliary indicators. Even if you have identified the movements of auxiliary indicators, you should always monitor the price movement. To determine support, you should monitor the price movement for at least 1-3 days. This is especially important during periods of volatility. Volatility is a period where you cannot predict the direction of movement, so extra caution is required. Therefore, if possible, it's better to observe the situation and find a trading opportunity after the volatility period has passed rather than entering a new trade during a volatile period. - Thank you for reading to the end. I wish you successful trading. -------------------------------------------------- - Here's an explanation of the big picture. (3-year bull market, 1-year bear market pattern) I'll explain more in detail when the bear market begins. ------------------------------------------------------
