Technical analysis by Henrybillion about Symbol PAXG on 11 hour ago

Henrybillion
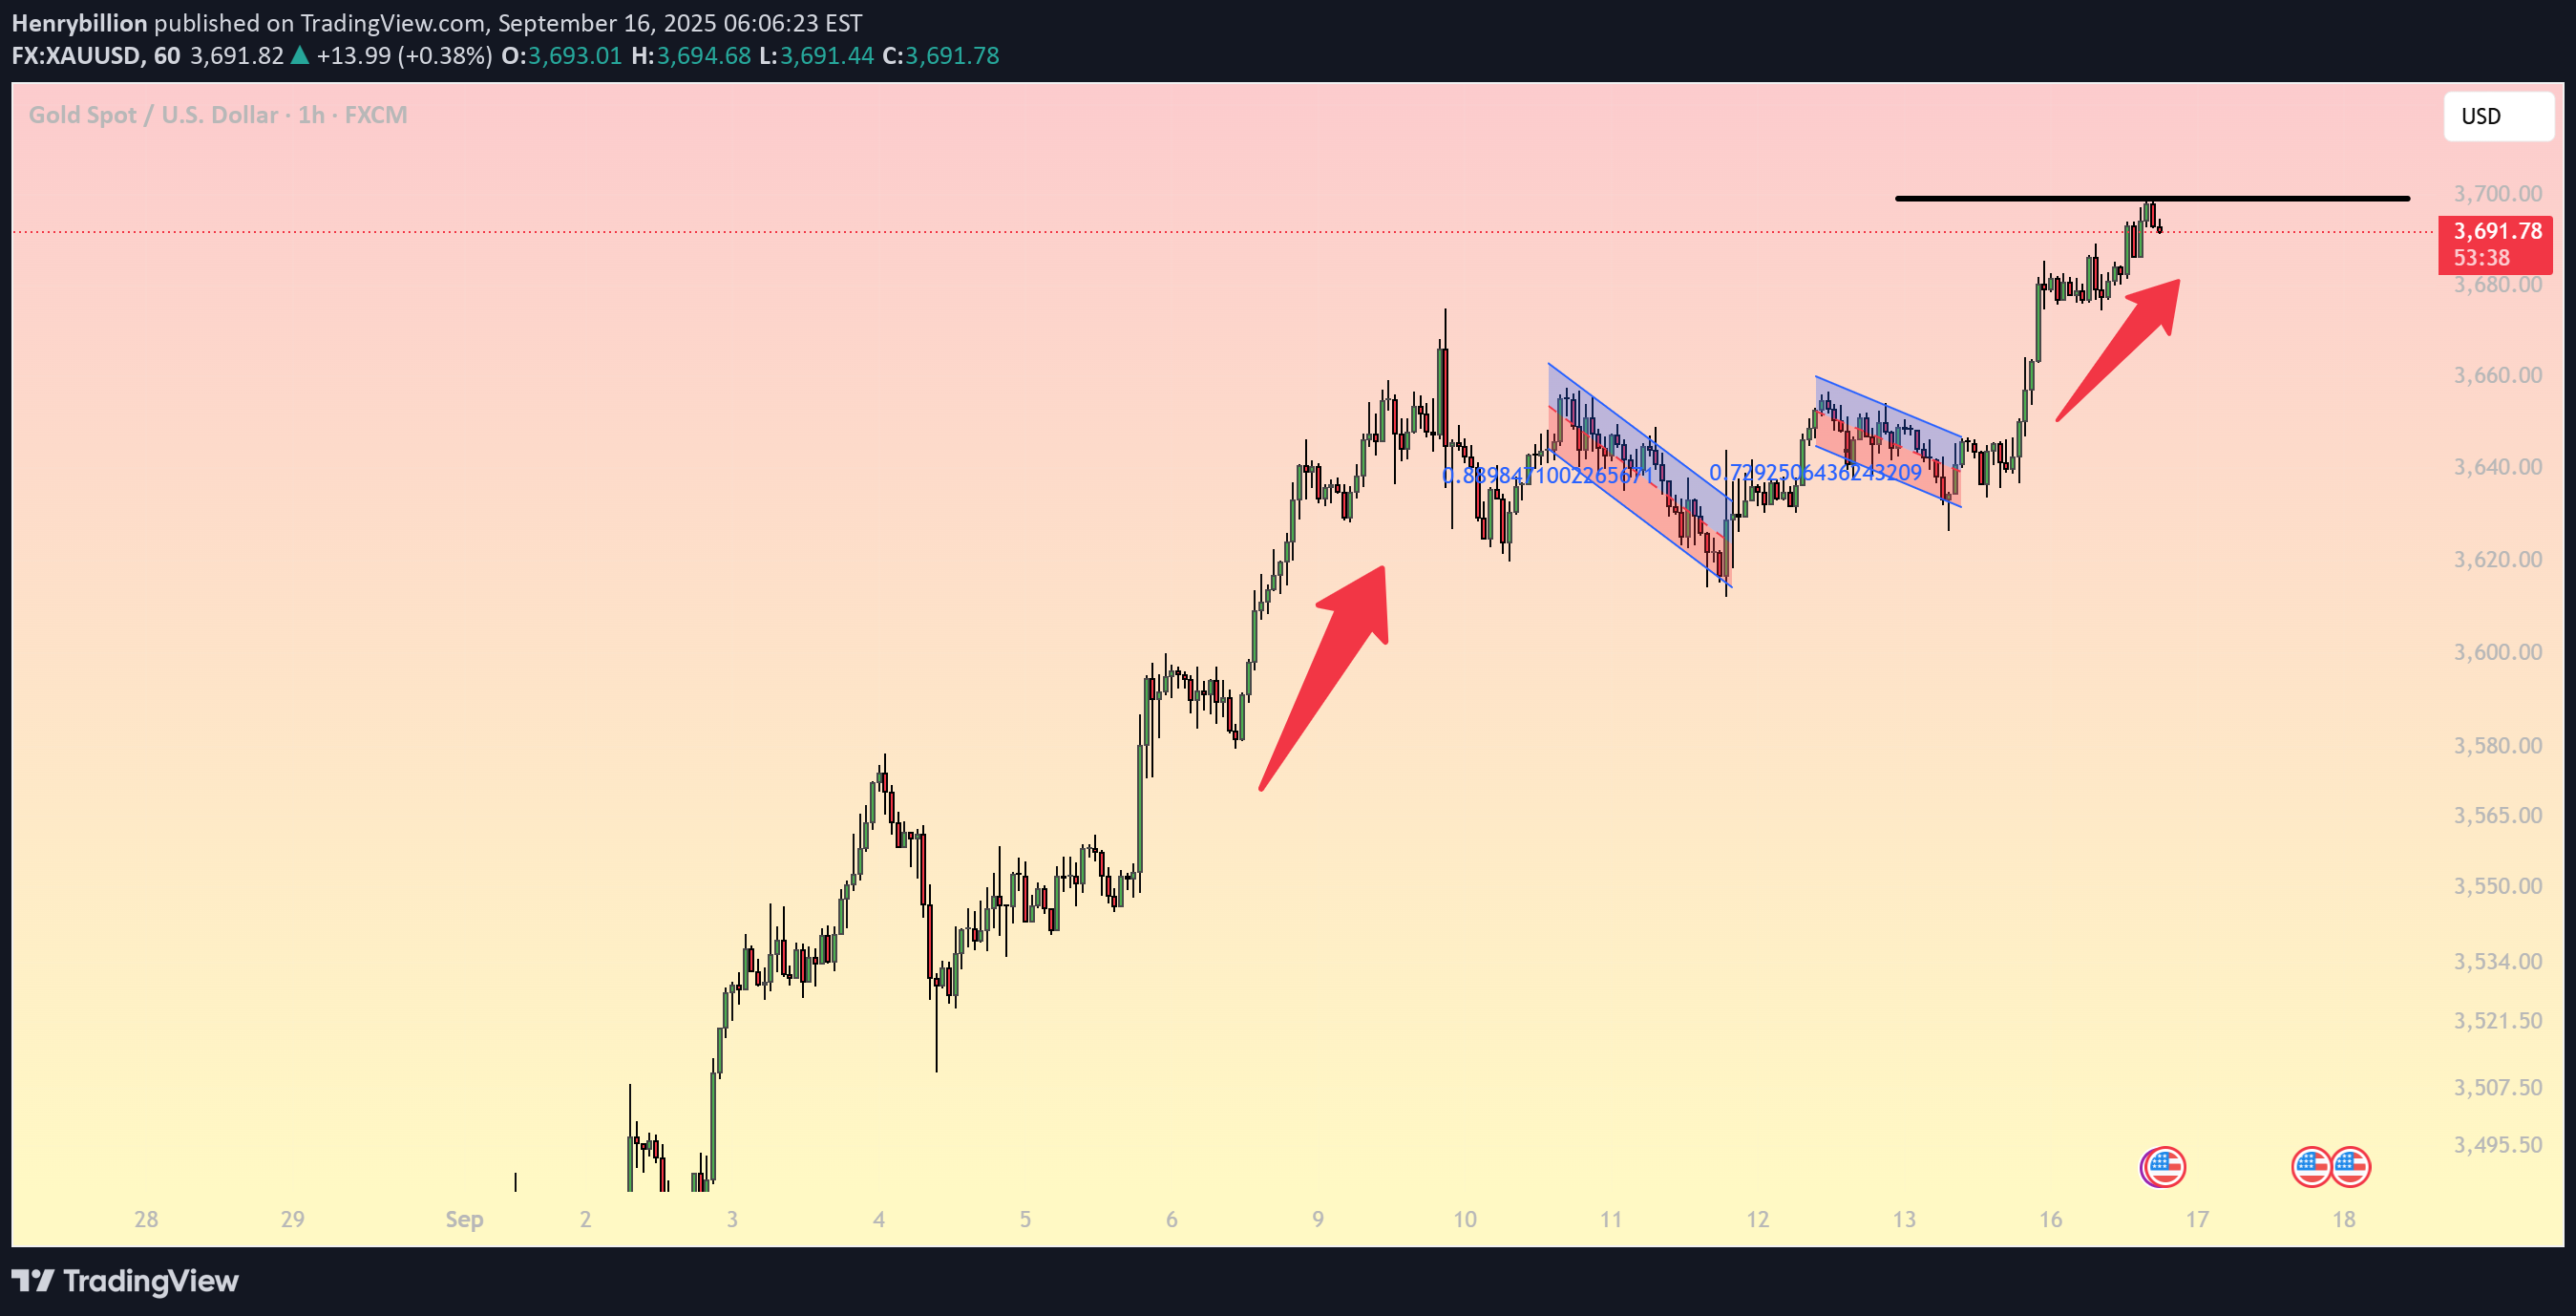
1. Main Trend Gold continues to show a strong bullish structure, supported by multiple bullish flag/pennant patterns. Each consolidation phase has been followed by a breakout to the upside, confirming that buyers remain in full control. 2. Key Support & Resistance Levels Immediate Resistance: 3,700 USD – a strong psychological level now being tested. Next Resistance: 3,720 – 3,735 USD if price breaks above 3,700. Near-Term Support: 3,675 USD (aligned with EMA20 on H1). Major Support Zone: 3,640 – 3,645 USD (previous breakout area & trendline confluence). 3. Technical Indicators EMA20 & EMA50: Price trades firmly above both EMAs, confirming a bullish trend. RSI (H1): Approaching 70, suggesting potential short-term pullback before continuation. Fibonacci Levels: A retracement toward the 38.2% level aligns with support at 3,645 USD. 4. Trading Strategies Strategy 1 – Breakout Buy: Enter long if price breaks and closes above 3,700 with momentum. Targets: 3,720 – 3,735 USD. Stop-loss: below 3,685 USD. Strategy 2 – Buy on Dip (safer entry): Wait for a pullback toward 3,675 – 3,645 USD. Targets: 3,700 – 3,735 USD. Stop-loss: below 3,625 USD. Strategy 3 – Short-term Sell (countertrend): If price rejects 3,700 with reversal candlesticks, short toward 3,675 USD. Stop-loss: above 3,705 USD. Conclusion: Gold remains in a strong uptrend with every dip being absorbed quickly. The 3,700 USD level is the key psychological barrier today. While the priority is still buying with the trend, traders should wait for either a confirmed breakout or a healthy pullback to enter at optimal levels. Follow this analysis to stay updated with new strategies, and save it if you find it useful for your trading plan.
