Technical analysis by MR_gold2 about Symbol PAXG: Buy recommendation (9/16/2025)

MR_gold2
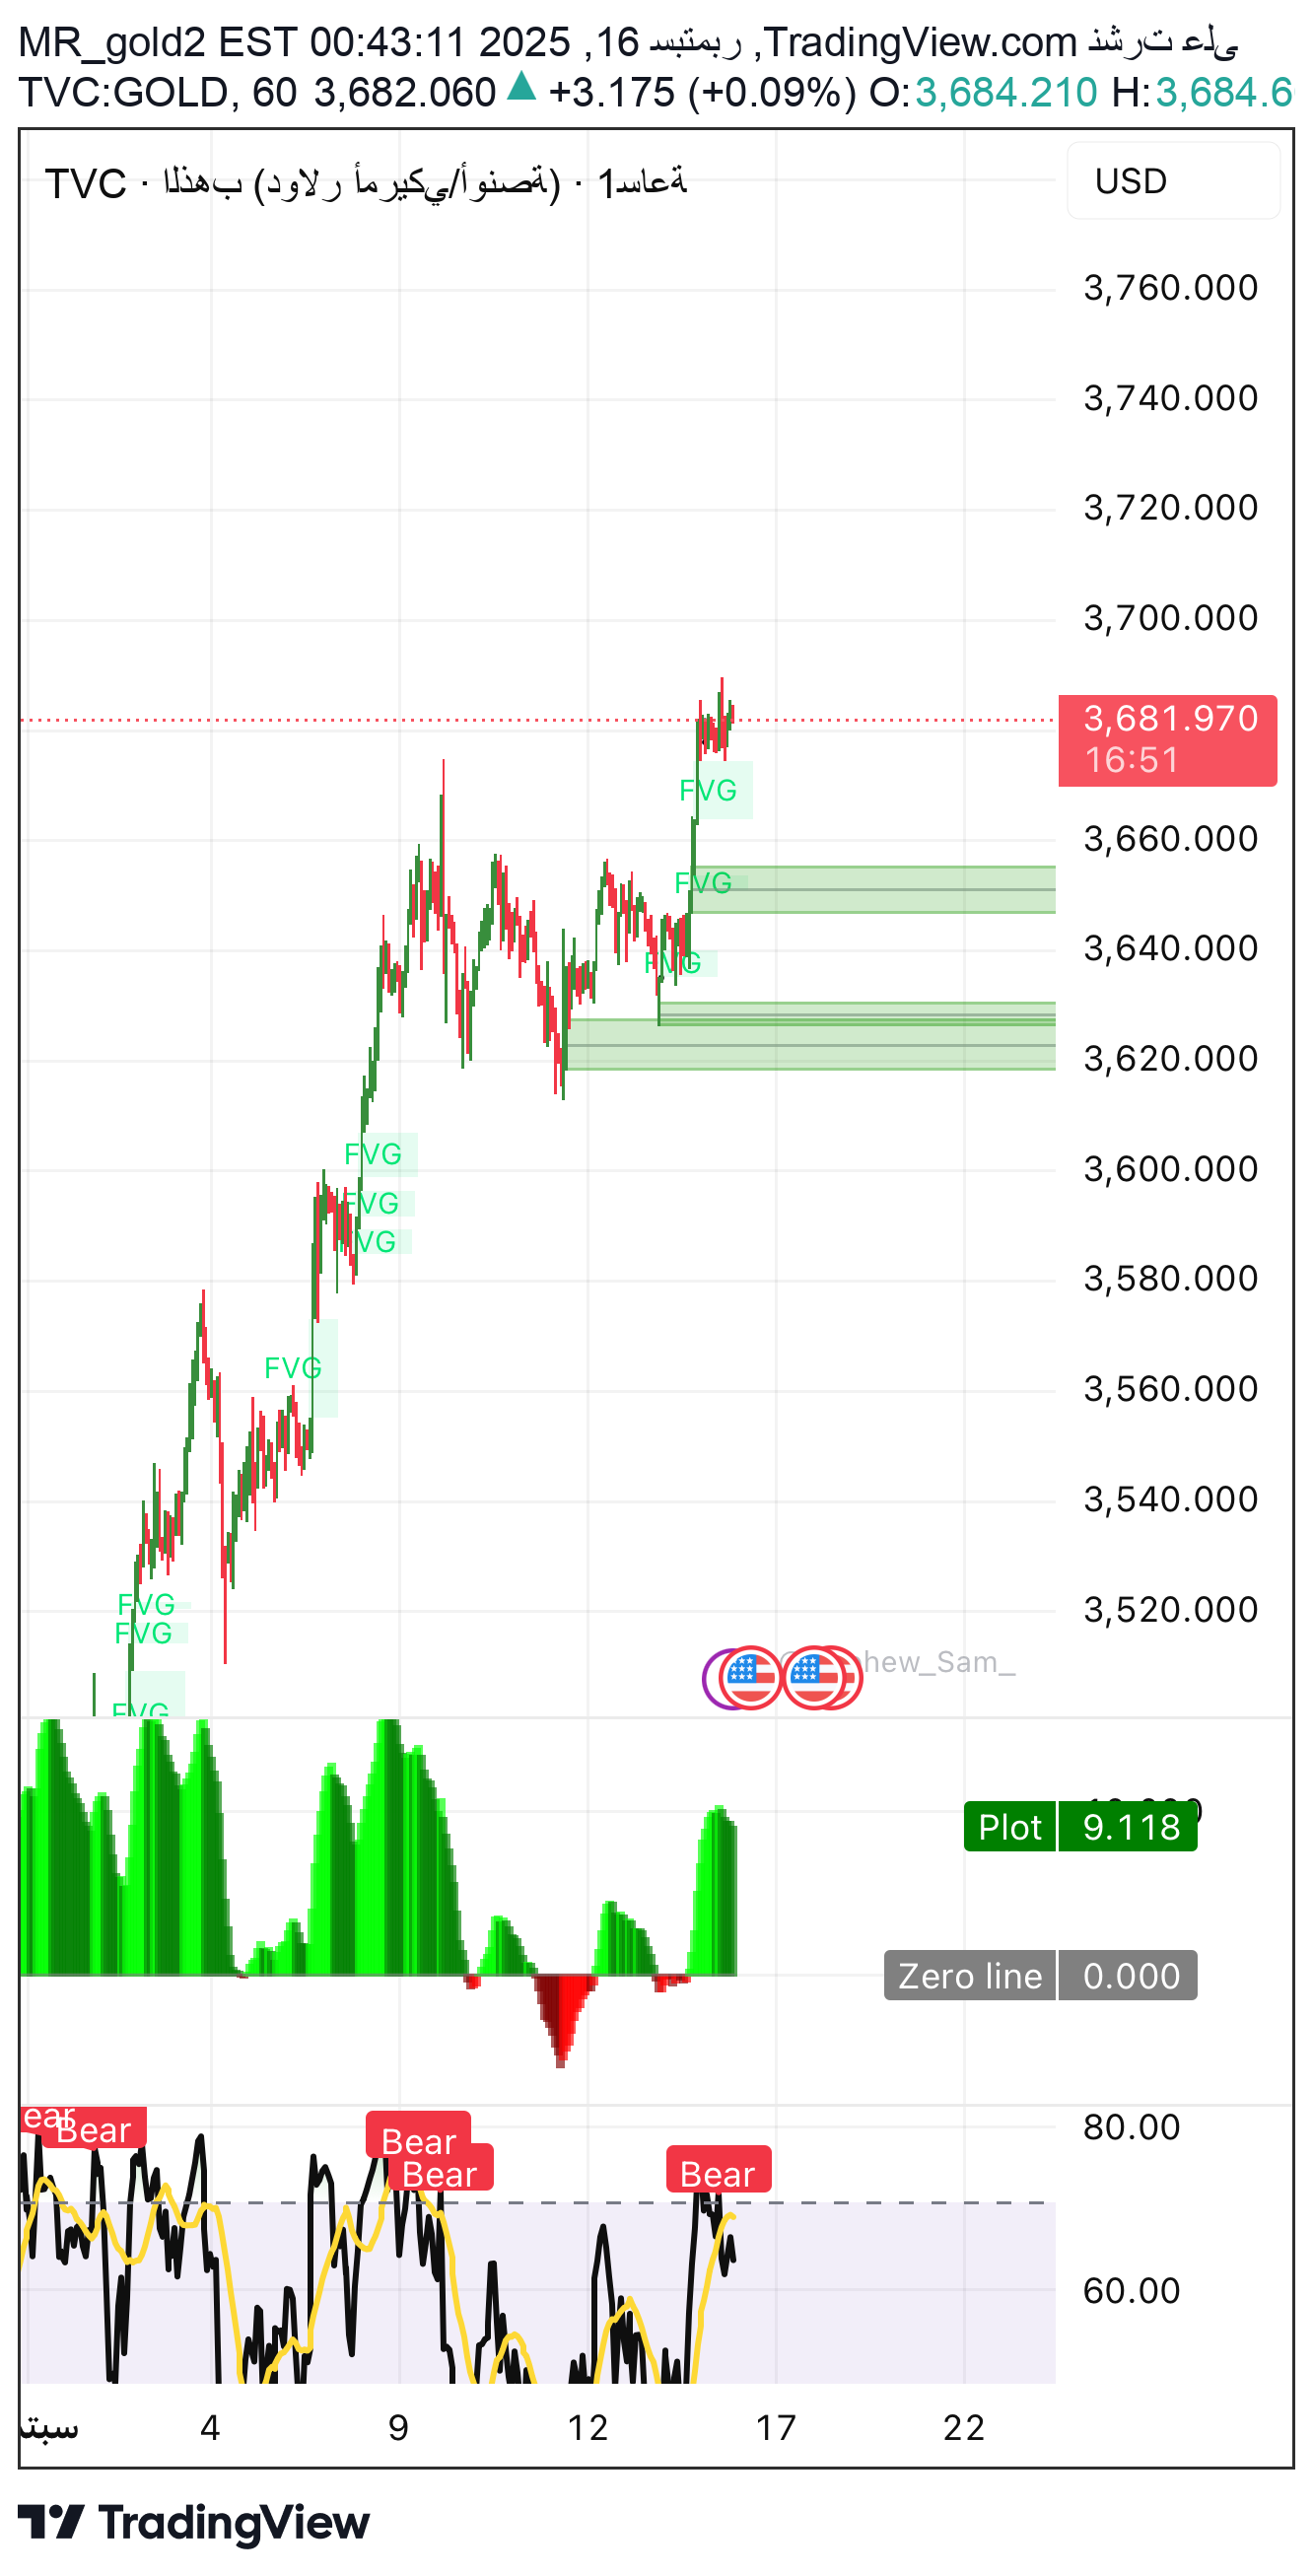
Congratulations on a deal on Monday Where I mentioned a purchase of 3620 targeted areas 3700 Technical Analysis • The price is currently at $ 3683 - $ 3684 per ounce. • The general trend is clearly rising • There are FVG (Fair Value Gaps) areas that appeared below the price between 3660, which are areas that can be tested the price as a correction before continuing to climb. • The lower indicator (mostly RSI with Bear alert) indicates that gold is close to the purchasing saturation area (above 70), so we are likely to witness a short -term correction. ⸻ 🔹 Elliott <0) • The current movement looks a driving wave (Impulse). • We are often in the wave (3) or near its end, and it may be followed by a wave correction (4) • The target for the fifth wave (5) may reach $ 3720 - $ 3740 if the momentum persists. ⸻ Time Cycles • The timeline shows that gold fluctuates every 2-3 days with a strong movement (climb/landing). • The current session started from the bottom of approximately $ 3,520 and ascended strongly, and the time indicates the possibility of profit reaping within a day or two. Or tomorrow, for fear of the federal news ⸻ Fibonacci & Levels • Fibonacci from the last wave of ascension: • 0.382 = $ 3660 • 0.5 = $ 3640 • 0.618 = $ 3620 (a strong support zone compatible with FVG). ⸻ Fundamental • Gold is supported by the US dollar DXY and the expectations for keeping the federal interest unchanged. • Geopolitical tensions and increased investment demand support the rising trend. • Any strong economic data for the dollar (CPI or retail sales) may press temporarily. ⸻ 🔹 Calls and resistance • Call: $ 3670-3675 $ 3660 - 3640 - $ 3620 • Resistance: $ 3687 3700 - 3720 - $ 3740 ⸻ 🔹 Technical models • There is no clear reflection model, but we notice the formation of an emerging base with FVG price gaps. • The possibility of forming the Bullish Flag model if the price corrects the side and then penetrates up. ⸻ Harmonic models • The AB = CD model may form an extended cd if the price returns to $ 3640 and then climb up to $ 3740. • There are also features of the Gartley Form ascending if corrected to 0.618 ($ 3620). ⸻ 🔹 Pivot Point (Pivot) PIVOT POINT is about $ 3665. • Trading over it enhances the upward trend. ⸻ Recommentation • Al -Za'i scenario: Searching for a purchase when correction is about 3660 with 3700 - 3720 - $ 3740 goals. In the event of any reflection reference appears • A short landing scenario: In the event of a break of $ 3620 with a closure of 4 hours, the correction may extend to $ 3580 • Risks Management: Put a loss Important note We do not give any investment or financial recommendations We offer you scientific and educational content You are a single person responsible for the pressure and purchase button If you do not have a strong strategy, you only need to join the students of the Sayyid Al -Dahab army Analyst Engineer Ehab Sayed Gold channel
