Technical analysis by Henrybillion about Symbol PAXG on 19 hour ago

Henrybillion
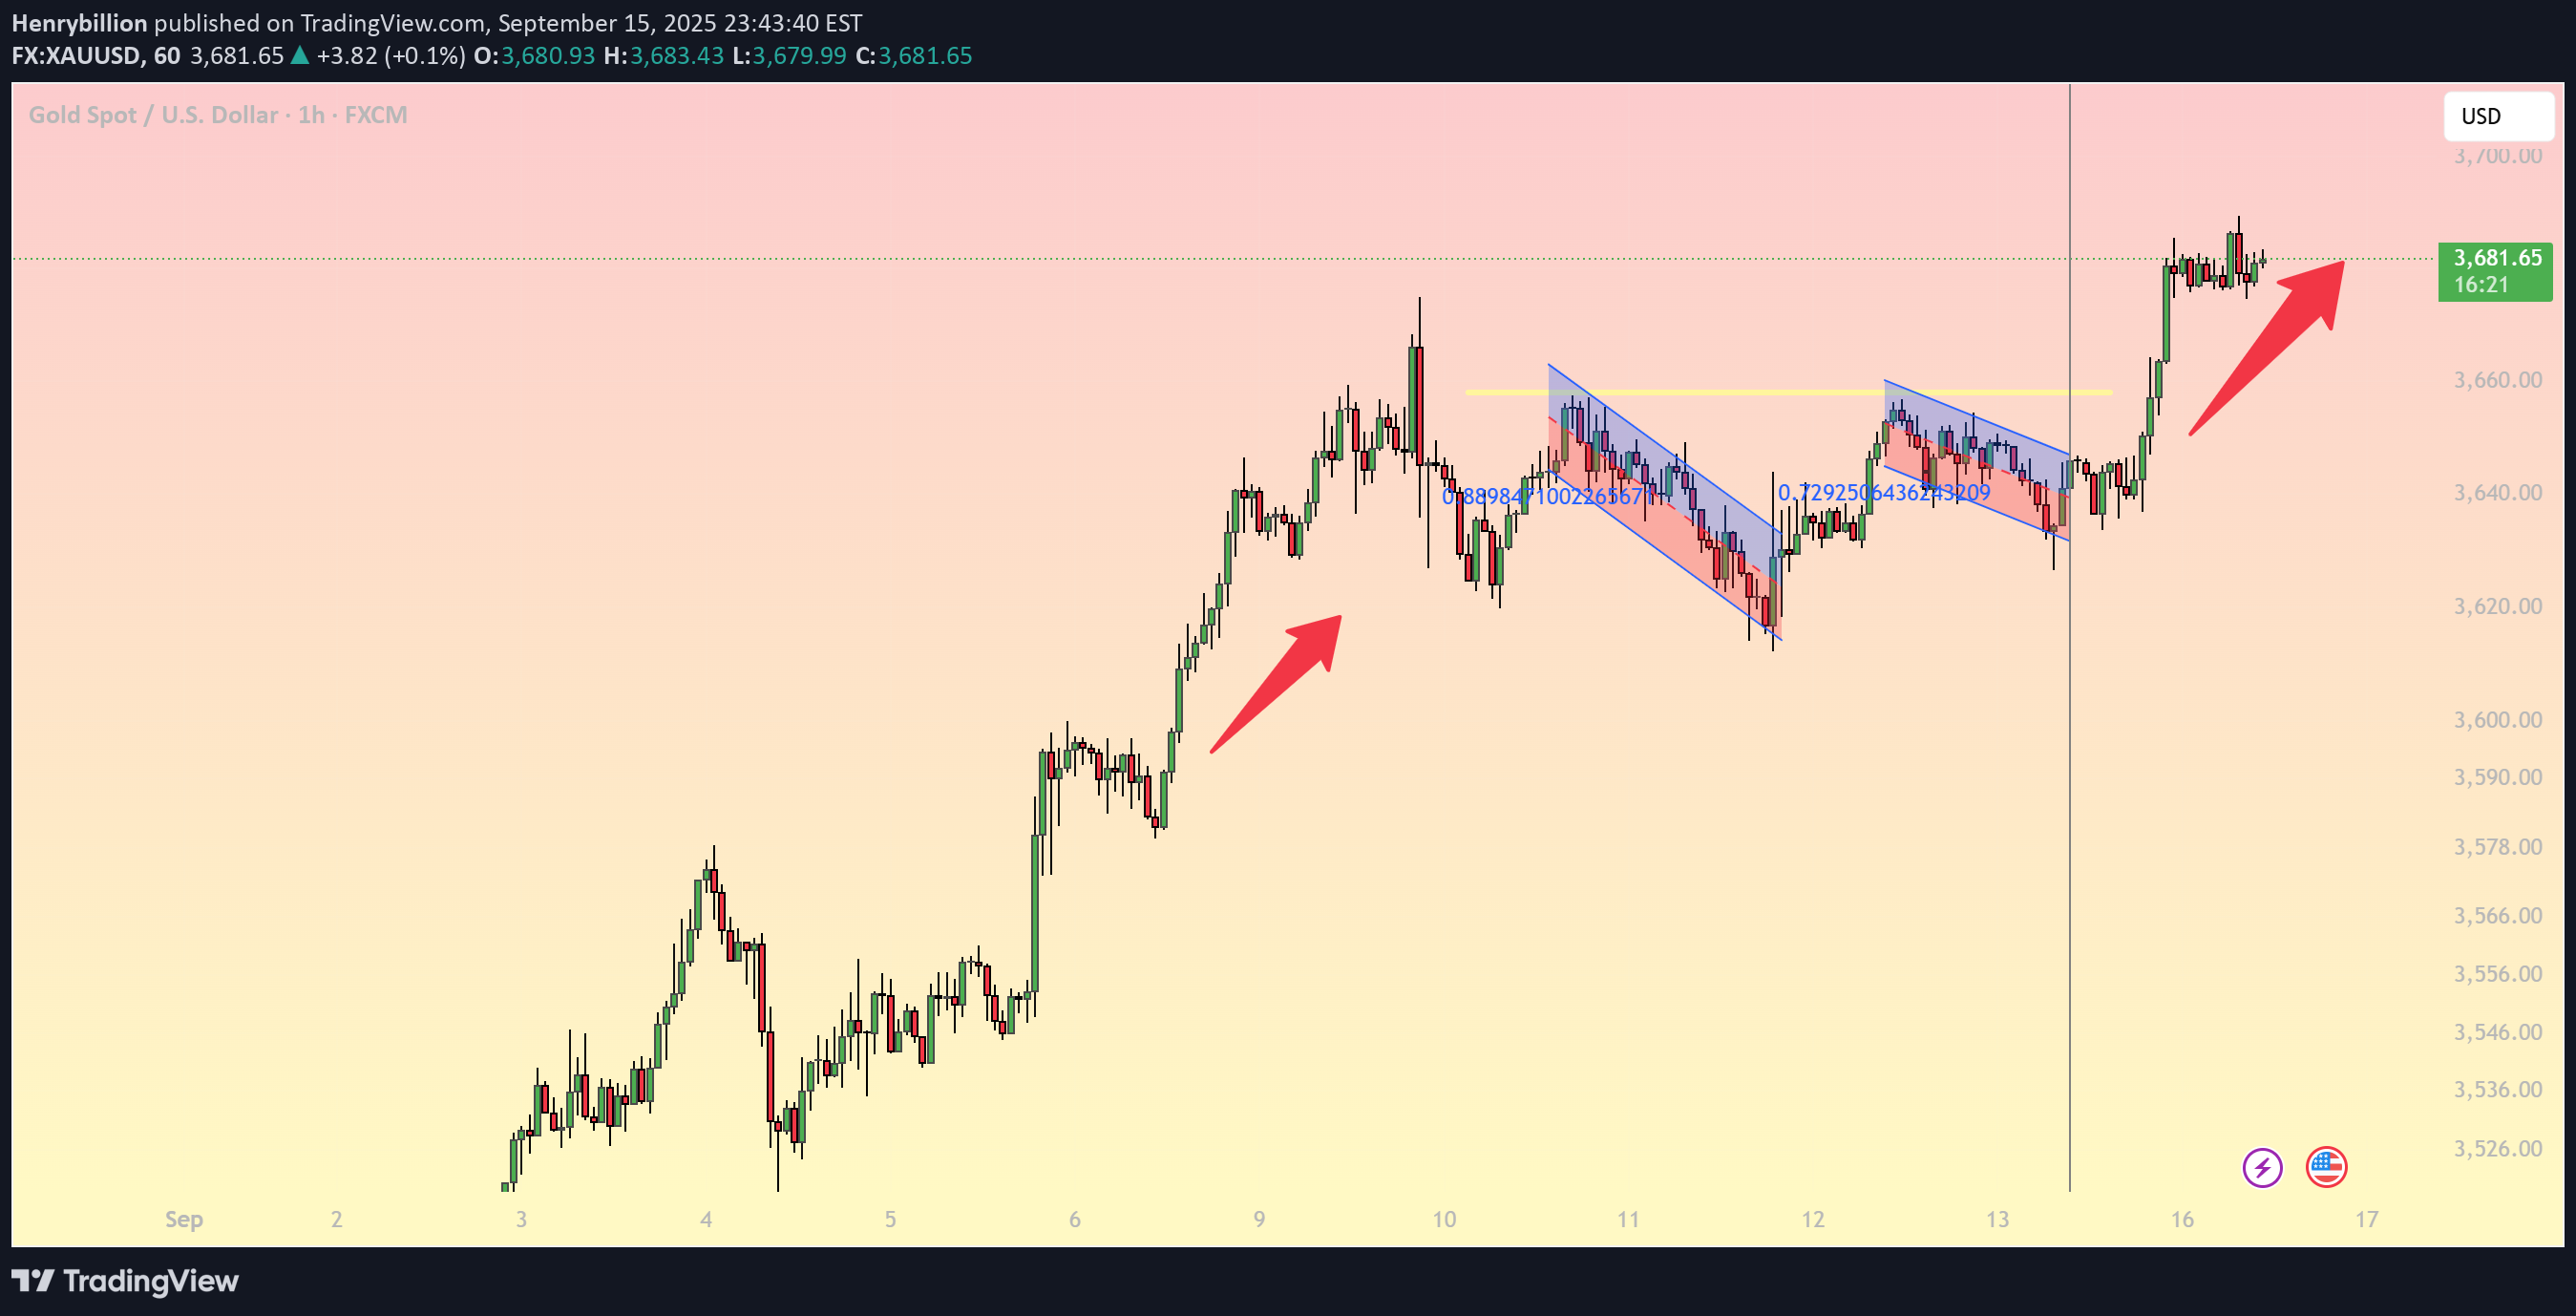
On the H1 chart, gold continues its strong bullish momentum, forming and breaking out of multiple bullish flag patterns. Each corrective pullback stayed inside a downward channel before breaking upward, confirming that the dominant trend remains uptrend. 1. Technical Outlook EMA: Price is trading well above short-term EMAs, showing strong bullish control. Trendline: The ascending trendline from early September is still intact with no sign of reversal. Fibonacci: The rally from 3,580 to 3,683 has a key Fib 38.2% retracement around 3,650 – 3,655, making it a critical support zone. RSI: Currently neutral (55–60), leaving room for further upside before reaching overbought levels. 2. Key Support and Resistance Levels Immediate Support: 3,655 – 3,660 (Fib 38.2% + trendline confluence). Major Support: 3,620 – 3,625 (previous correction low). Immediate Resistance: 3,690 – 3,700 (short-term high). Major Resistance: 3,720 – 3,725 (psychological barrier + Fib 161.8% extension). 3. Trading Strategies Strategy 1: Buy on Dip Entry: 3,655 – 3,660 Stop Loss: 3,640 Take Profit: 3,690 – 3,700, extended to 3,720 Strategy 2: Breakout Buy If price breaks above 3,690 – 3,700 with strong volume Target: 3,720 – 3,725, extended to 3,750 Stop Loss: below 3,680 Strategy 3: Intraday Scalping On M15 chart, buy around 3,670 – 3,675 during minor pullbacks Quick targets toward 3,690 4. Conclusion The overall bias for today remains bullish. Buying on dips near support zones is favored over counter-trend selling. Watch the 3,655 support and 3,700 breakout level closely, as they will determine today’s directional move. If gold breaks and holds above 3,700, the door opens for a potential rally toward 3,750+.
