Technical analysis by Henrybillion about Symbol PAXG on 9/15/2025

Henrybillion
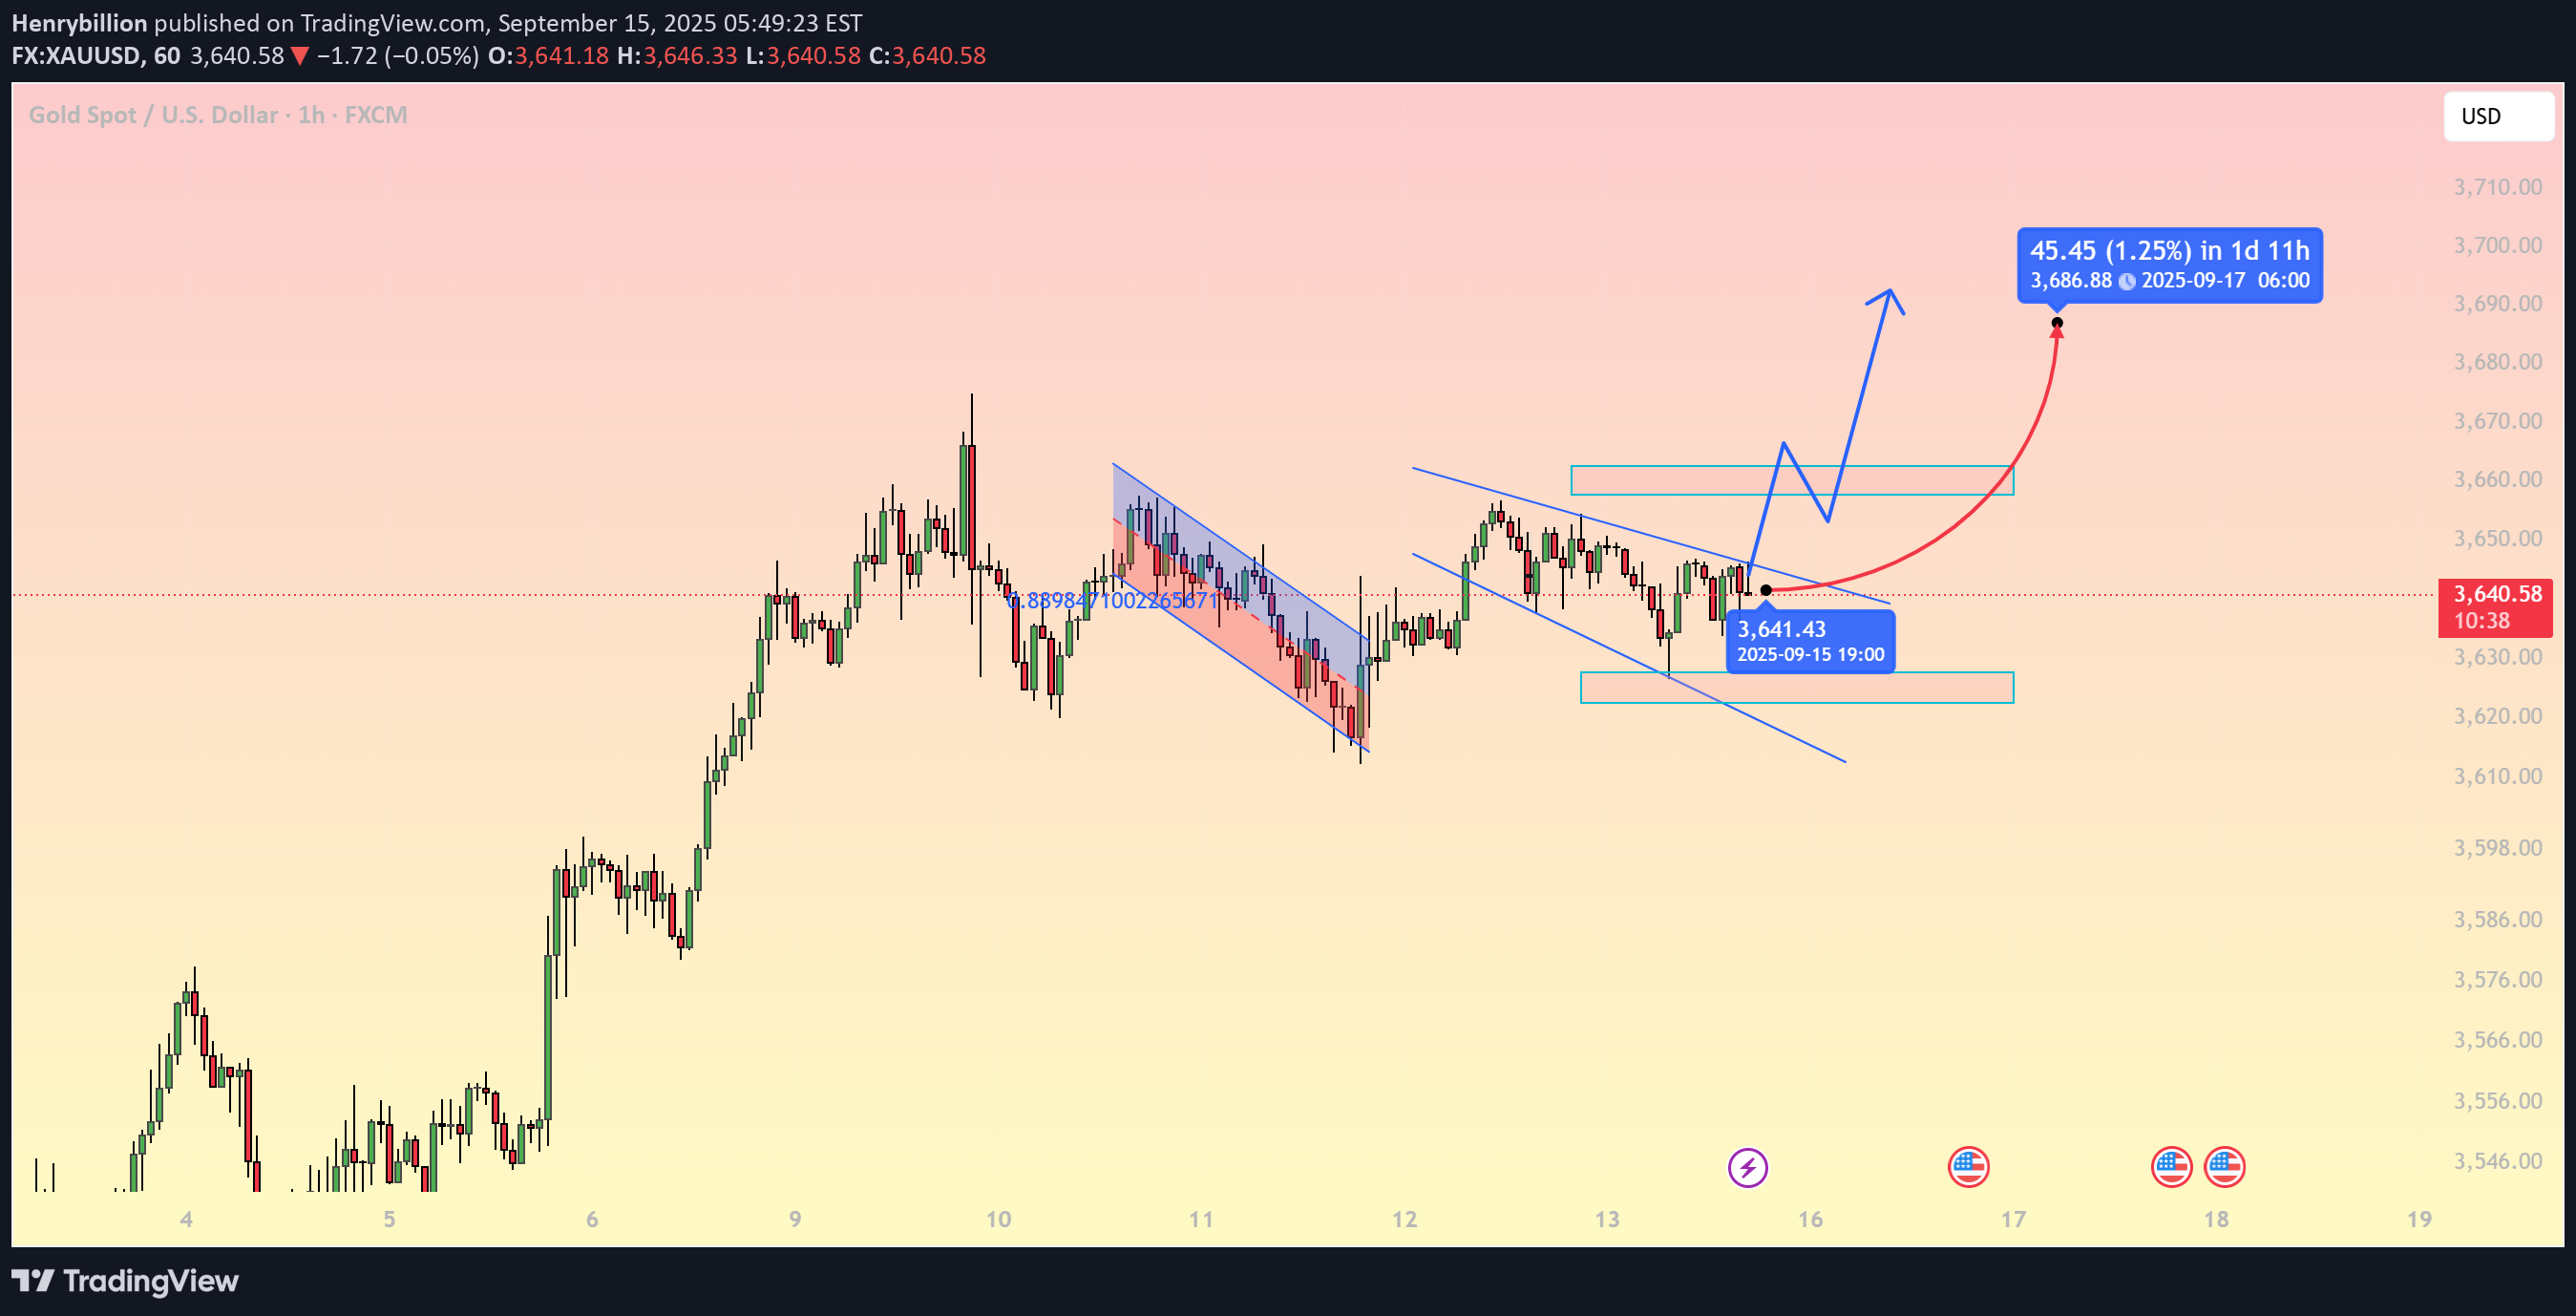
1. Main Trend Gold is consolidating within a falling wedge pattern on the H1 chart, often considered a bullish continuation setup. After last week’s strong rally, price is now ranging around 3,641 – 3,645 USD/oz, holding well above key support levels. 2. Key Support & Resistance Levels Immediate Support: 3,641 USD (a break below could lead to 3,625 USD). Near Resistance: 3,655 – 3,660 USD (upper wedge boundary). Major Resistance: 3,686 – 3,690 USD (Fibonacci extension zone, breakout target). 3. Technical Indicators EMA 50 & 200 (H1): Price is consolidating above EMA 50, showing that bullish momentum remains intact if 3,640 holds. RSI (14): Hovering near the 50 mark, leaving room for upside if the wedge breaks. Fibonacci: Current retracement aligns with the 0.382 level, a common support zone for trend continuation. 4. Trading Strategies: Bullish Scenario (primary): Wait for a confirmed breakout and H1 close above 3,655 – 3,660 USD. Short-term targets: 3,675 – 3,686 USD. Extended target: 3,700 – 3,710 USD if momentum accelerates. Pullback Scenario: If price breaks below 3,640 – 3,641 USD, expect a retest of 3,625 USD. This zone may still provide a buying opportunity unless structure breaks further. 5. Risk Management Stop-loss below 3,620 USD to protect against false breakouts. Maintain at least a 1:2 risk-to-reward ratio for optimal trade setups. Conclusion: Gold is building momentum for a potential breakout above 3,660 USD, with upside targets toward 3,686 – 3,700 USD. Traders should stay patient and wait for a clear confirmation before entering. Follow for more daily gold trading strategies and remember to save this analysis if you find it useful.
