Technical analysis by Henrybillion about Symbol PAXG on 9/15/2025

Henrybillion
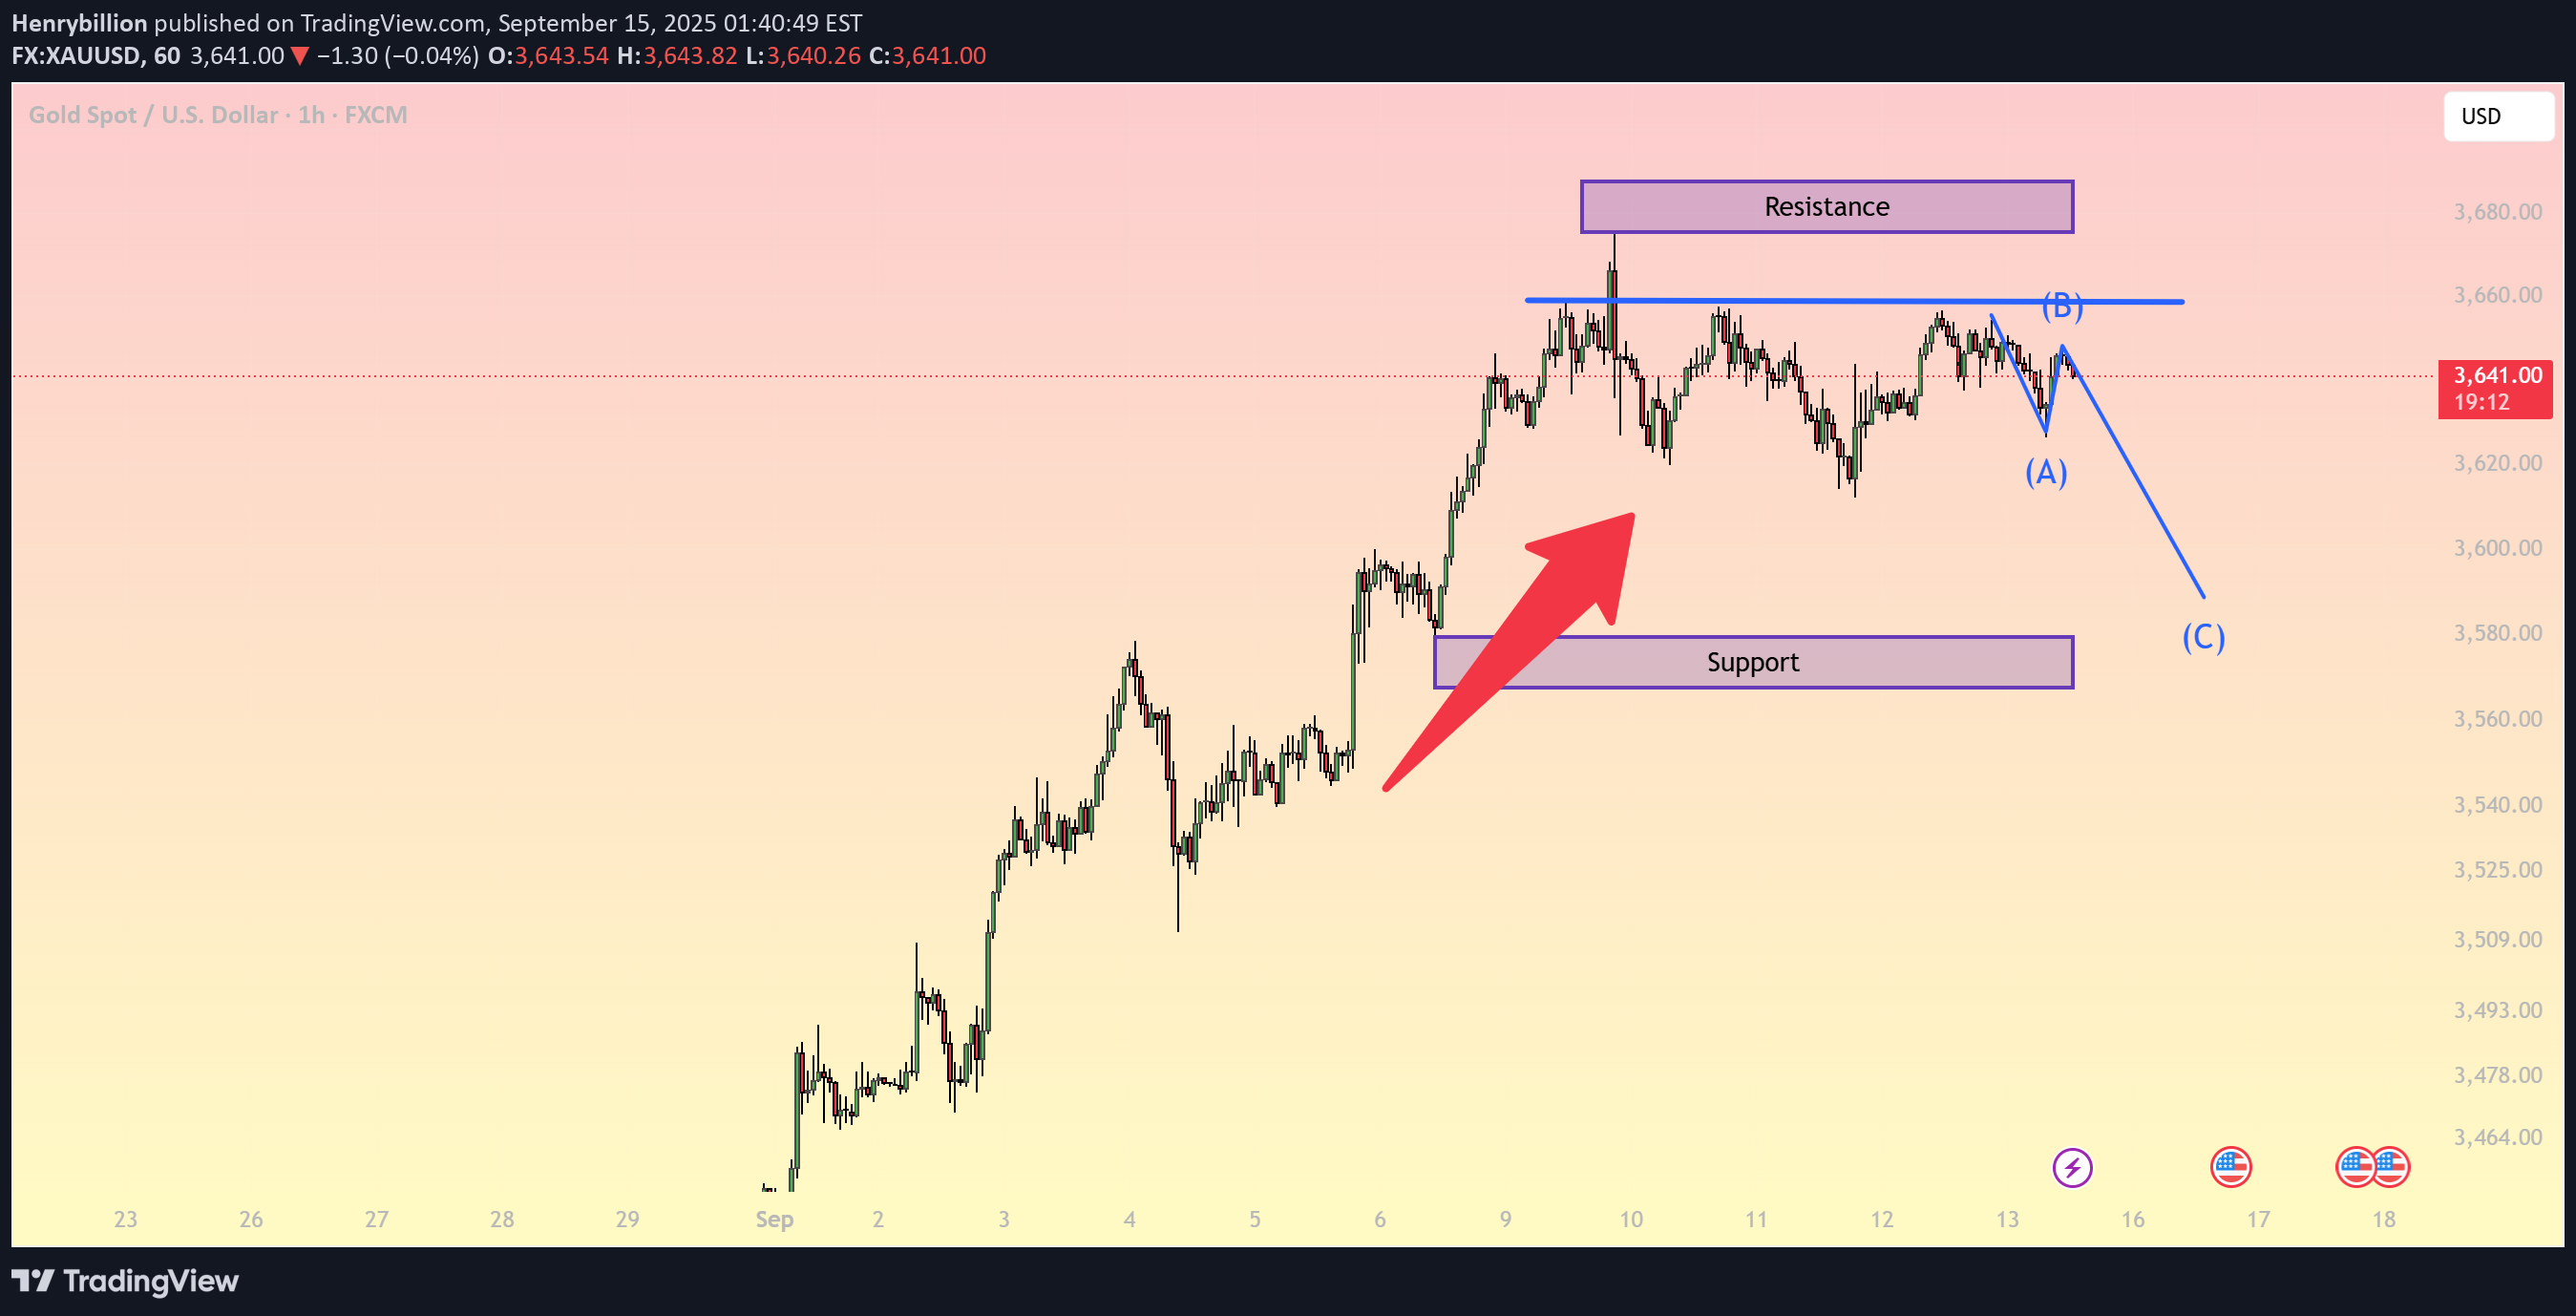
1. Main Trend Gold (XAUUSD) has recently rallied from 3,560 → 3,665, but on the H1 timeframe the market is now forming a potential ABC corrective structure. Wave (A) has completed. Wave (B) is a technical pullback. Wave (C) is expected to push lower, testing key support levels. 2. Key Resistance Levels 3,660 – 3,670 USD/oz: Major resistance zone where price has been rejected multiple times. This area also aligns with the 20 EMA on H1 and the 61.8% Fibonacci retracement of wave (A). 3. Key Support Levels 3,600 – 3,610 USD/oz: First support to watch. A breakdown here could accelerate the bearish move. 3,575 – 3,585 USD/oz: Strong support area, confluence with the 161.8% Fibonacci extension of wave (A). 4. Technical Indicators RSI (H1): Turning lower from the 50 midline, suggesting bearish momentum. EMA 50 – EMA 200: Both EMAs still sloping upward, but price is testing the lower band, signaling a short-term correction. Price Action: Repeated rejections around 3,660 highlight sellers’ dominance. 5. Trading Strategies for Today Short Setup (Preferred) Sell limit: 3,655 – 3,660 Stop loss: 3,675 Take profit 1: 3,610 Take profit 2: 3,580 Countertrend Buy (Speculative) Buy: 3,580 – 3,585 Stop loss: 3,565 Take profit: 3,620 – 3,630 - Conclusion: Gold is currently in a short-term corrective phase, with downside potential towards 3,600 – 3,580. Sellers remain in control on the H1 chart. Traders should monitor support reactions closely to identify any short-term buying opportunities. - Save this analysis if you find it useful, and follow for more trading strategies in the next sessions.
