Technical analysis by readCrypto about Symbol BTC on 9/14/2025

readCrypto
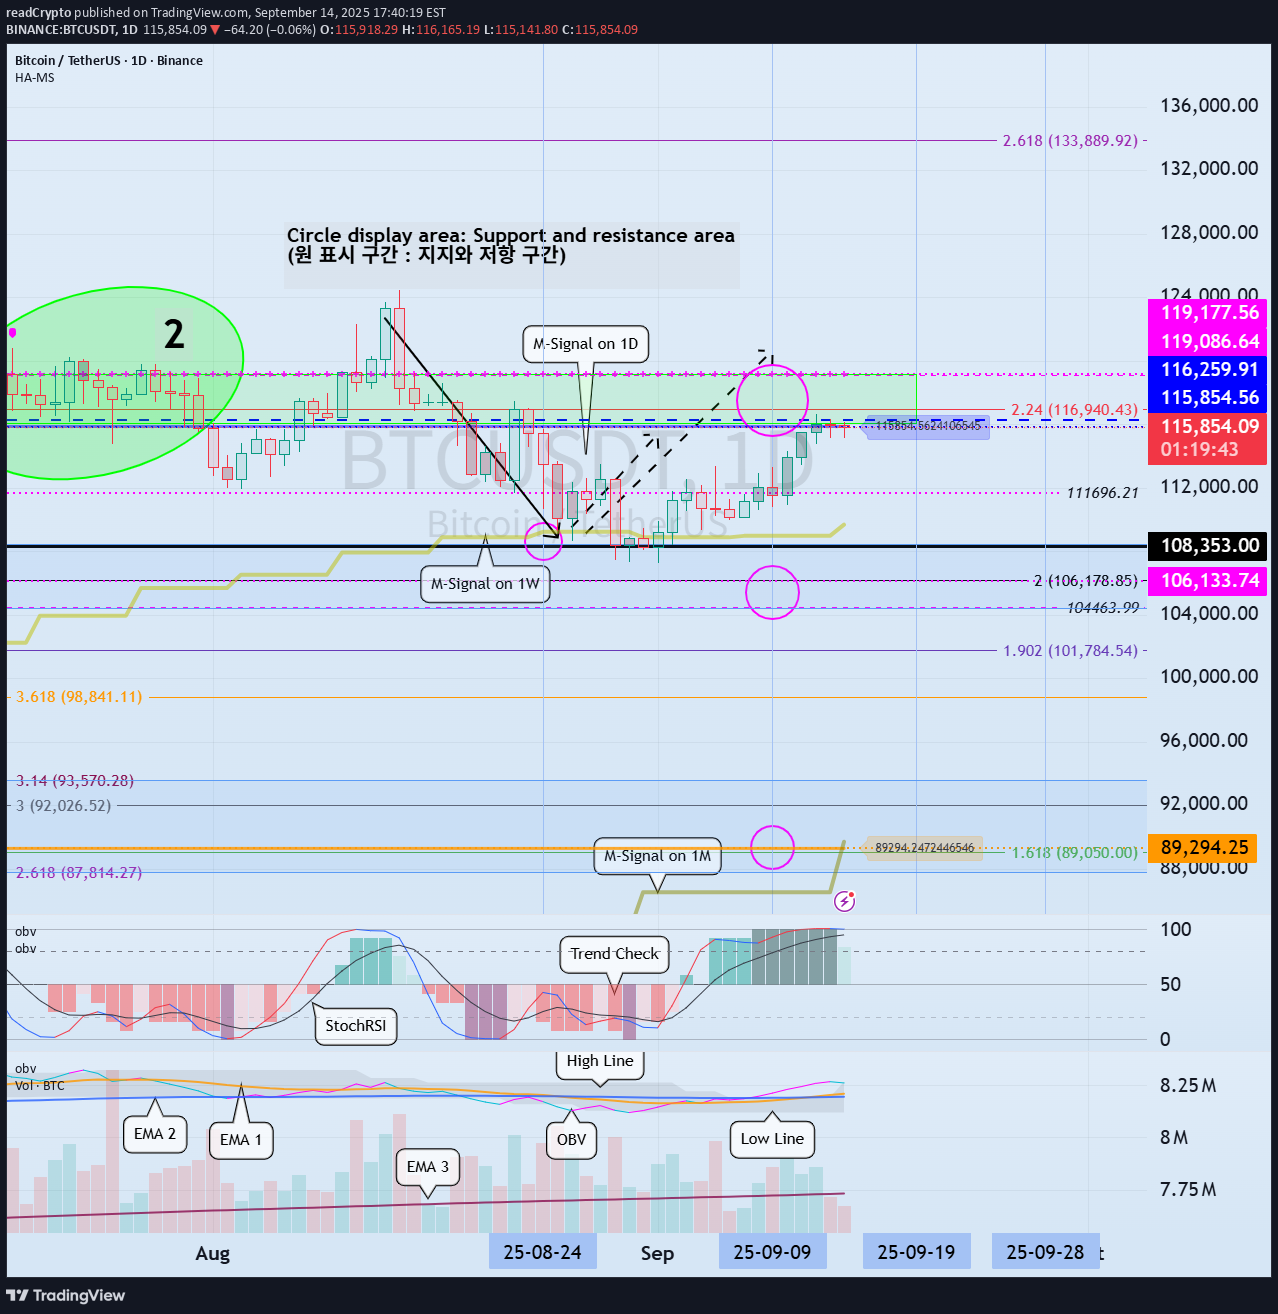
Hello, fellow traders! Follow us to get the latest information quickly. Have a great day! ------------------------------------- (BTCUSDT 1D chart) Looking at the big picture, there are two important areas. These are the 104463.99-18353.0 and 84814.27-93570.28 levels. To continue the stepwise uptrend, an upward breakout of the 116259.91-119177.56 level is necessary. The M-Signal indicator on the 1D and 1W charts is passing through the 108353.0-116259.91 level. If support is found in this area, the price is likely to continue attempting to break above the 116259.91-119177.56 level. If the price declines to the 104463.99-18353.0 level and encounters resistance, it is expected to eventually encounter the M-Signal indicator on the 1M chart. Currently, the M-Signal indicator on the 1M chart is moving between 84814.27 and 93570.28, so it's important to determine whether it can find support within this range. -------------------------------------- Two OBV EMA lines have been added to the OBV indicator in the Low Line ~ High Line channel. OBV EMA 1 can be used as a short-term indicator, EMA 2 as a medium-term indicator, and EMA 3 as a long-term indicator. Disabling EMA 3 reveals that the OBV is currently above both EMA 1 and EMA 2, indicating a transition from EMA 1 to EMA 2. If OBV rises above the High Line and remains above it, the price is likely to continue its upward trend. Currently, the price has been trending upward as the OBV indicator has risen above the High Line, but with the High Line indicator re-emerging, it appears to be declining below the High Line. However, as mentioned earlier, since the OBV indicator is holding above EMA 1 or EMA 2, the key is whether the current support and resistance zones hold support. In other words, the key is whether support can be found and an upward movement can occur around the 115,854.56-116,259.91 range. The 115,854.56 and 116,259.91 points are the HA-High indicator levels on the 1D and 1W charts. Therefore, the current support and resistance zones should be considered resistance zones and a corresponding strategy should be developed. The basic trading strategy is to buy between DOM(-60) and HA-Low and sell between HA-High and DOM(60). However, if the price rises in the HA-High ~ DOM(60) range, it could exhibit a step-like upward trend, while if it falls in the DOM(-60) ~ HA-Low range, it could exhibit a step-like downward trend. Therefore, the basic trading strategy should be a segmented trading strategy. Therefore, those who bought near the DOM(-60) ~ HA-Low range should consider selling in segments. If you want to make a new purchase, you can do so when the HA-High ~ DOM(60) range shows support. However, this requires a quick and short response, so caution is advised. From a broader perspective, this means buying in a sell zone. - I believe whether the price will rise or fall in the future depends on whether it can break above Zone 1. There's a possibility of a bear market turning around, with a new all-time high (ATH) occurring between the week of November 24th and the week of January 26th, 2026. More details will likely emerge as this month progresses. This month's volatility period will be around September 19th and September 28th. - Thank you for reading. I wish you successful trading. -------------------------------------------------- - This is an explanation of the big picture. (3-year bull market, 1-year bear market pattern) I will explain in more detail when the bear market begins. ------------------------------------------------------#BTCUSDT The key is whether it can find support and rise in the 115854.56-119177.56 range. The next volatility period is around September 19th (September 18th-20th).
