Technical analysis by jacesabr_real about Symbol BTC: Sell recommendation (9/13/2025)

jacesabr_real
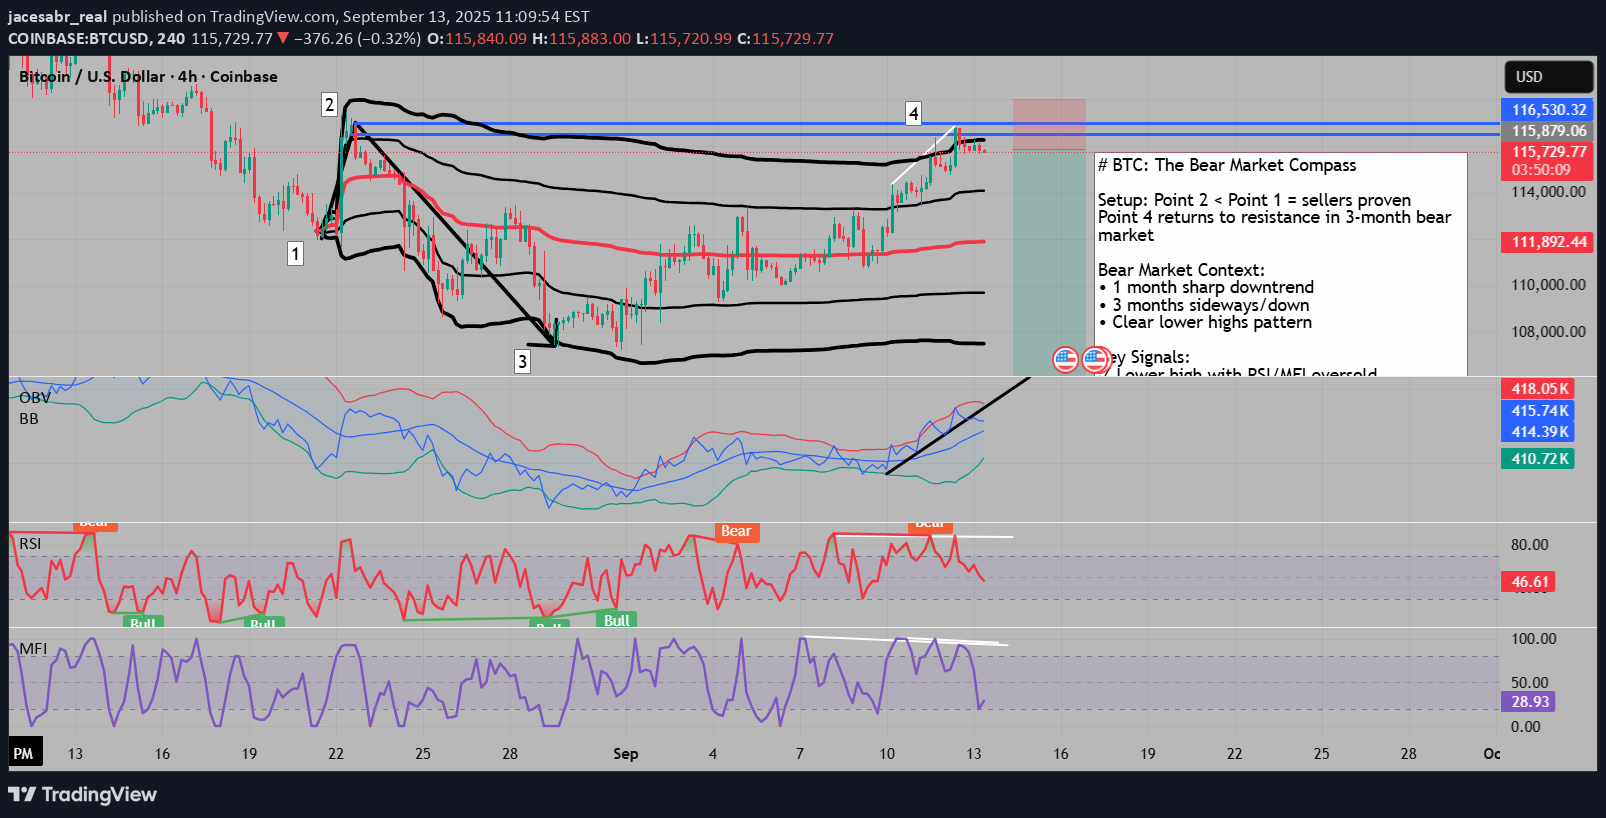
# The Bear Market Compass: BTC's 2-Sigma Rejection Signal ## Proven Sellers Established (Points 1→3) The market structure crystallized when Point 2 closed below Point 1 , establishing proven seller territory. This breakdown to Point 3 confirmed sellers' control over the market. Now at Point 4 , price has returned to test these proven sellers' resolve. ## The Three-Month Bear Market Context We're not looking at an isolated pattern - this is occurring within a three-month bear market : • One month of sharp downtrend • Three months including sideways/down action • Clear lower highs and lower lows pattern This context transforms Point 4 from a potential breakout to a likely bull trap - a relief rally within a broader downtrend. ## The Oversold Paradox At Point 4, we see: • Price: Lower high formation • RSI/MFI: Both oversold This creates the "oversold paradox" - indicators showing exhaustion but at resistance rather than support. When oversold conditions can't push price to new highs, it reveals fundamental weakness. ## VWAP 2nd Deviation Rejection Anchoring VWAP at Point 1 reveals the critical signal: price closed outside the 2nd standard deviation then pulled back . This sequence suggests: • Initial thrust above 2-sigma failed to hold • Statistical extreme rejection (95% probability zone) • Unless price shows immediate strength, this marks a local top The pullback from 2-sigma without continuation higher is a classic reversal signature. ## Multiple Technical Warnings Bollinger Band Test: Price testing upper band in bear market context OBV Trendline Break: Potential break indicating selling interest increasing Volume Profile: Resistance cluster at Point 2 level ## Chaos Theory Probability Edge The Chaos Theory indicator provides a 59% probability of reaching 114,767 . This isn't just a target - it's a mathematical edge that: • Confirms the VWAP reversal signal • Provides clear stop above Point 2 • Offers exceptional 1:6 risk/reward potential ## Risk Management Framework Entry: Current levels (115,865) Stop Loss: Above Point 2 resistance (117,998) Target: 108,000 (Chaos Theory zone - approximately 1:6 R:R) Probability: 59% according to Chaos Theory Position Advantages: • Three-month bear market context • VWAP 2-sigma rejection • Mathematical probability edge • Clear invalidation above proven resistance ## The Bear Market Compass In bear markets, rallies to resistance are gifts for shorts. This setup combines: 1. Structural resistance (proven sellers) 2. Statistical extremes (VWAP 2-sigma) 3. Momentum exhaustion (oversold at resistance) 4. Mathematical edge (59% Chaos probability) 5. Trend alignment (three-month downtrend) --- Key Insight: When a three-month bear market produces a rally that reaches VWAP 2-sigma resistance while oversold, then immediately pulls back, you're likely witnessing the end of a relief rally, not the start of a reversal. The 59% Chaos Theory probability with 1:6 R:R makes this an asymmetric opportunity.
