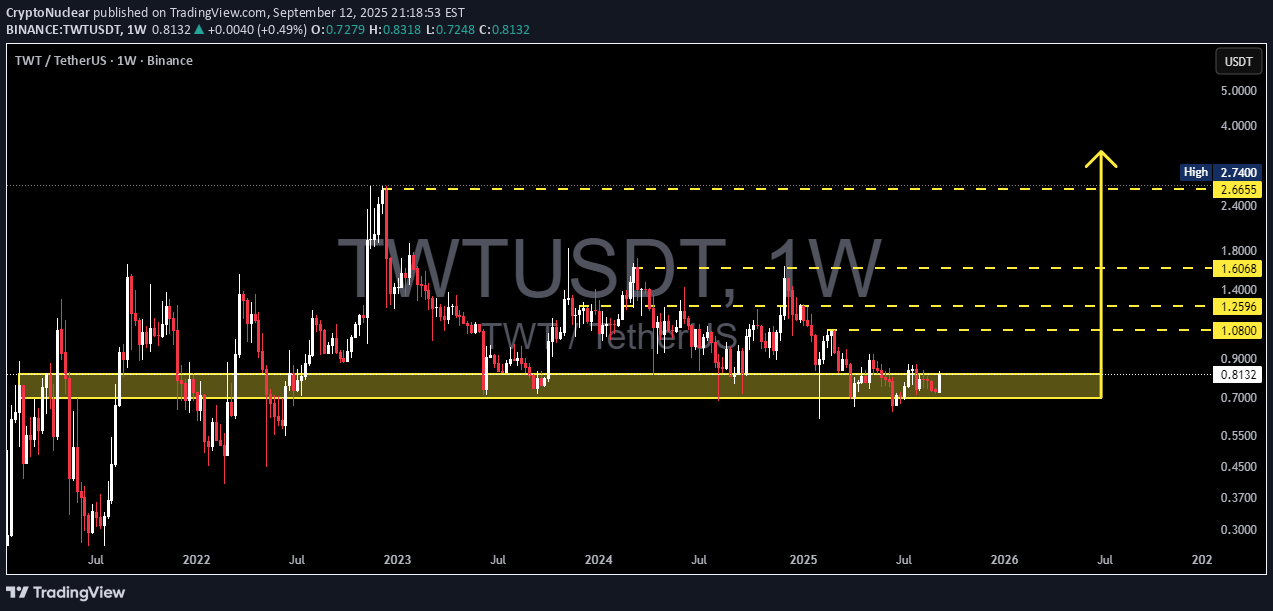
Technical analysis by CryptoNuclear about Symbol TWT: Buy recommendation (9/13/2025)

CryptoNuclear

📌 Overview Trust Wallet Token (TWT) has been forming a major pattern on the weekly timeframe for over 3 years. The current price hovers around 0.81 USDT, sitting right inside the multi-year demand zone that has repeatedly acted as a key accumulation area since 2021. This zone is more than just sideways price action — it’s a critical inflection point that could determine the medium-to-long-term trend. --- 📊 Market Structure & Key Pattern Multi-Year Demand Zone (0.67 – 0.90 USDT): A golden area that has historically prevented further downside multiple times since 2021. Series of Lower Highs (since 2022): Every rally has failed to break higher, showing sellers still dominate the mid-term structure. Sideways Battle Zone: Buyers are defending hard, sellers are capping every move. This is a textbook accumulation vs. distribution phase. --- 🔑 Key Levels Main Support: 0.67 – 0.90 USDT (demand zone). Layered Resistances: 1.08 USDT → first critical resistance. 1.26 USDT → mid-level target. 1.60 USDT → strong structural resistance. 2.66 – 2.74 USDT → major supply zone / high target. Downside supports if breakdown occurs: 0.55 → 0.30–0.40 USDT. --- 🚀 Bullish Scenario 1. Rebound from Demand: Strong weekly rejection (pin bar / bullish engulfing) inside the zone could trigger a rally toward 1.08 → 1.26 USDT. 2. Confirmed Breakout: A weekly close above 1.08 USDT with strong volume would be the first real reversal signal. Step targets: 1.26 → 1.60 USDT. Sustained breakout may unlock upside toward 2.66–2.74 USDT. 3. Market Narrative: Long-term buyers see this area as a “multi-year discount” accumulation zone. If BTC turns bullish, TWT could become one of the altcoins that follow explosively. --- 🩸 Bearish Scenario 1. Weekly Breakdown below 0.67: A decisive close would confirm the failure of demand. Downside targets: 0.55 → 0.30–0.40 USDT. 2. False Pump: A rejection from 1.08–1.26 could trigger another sell-off back into support, increasing breakdown risk. 3. Market Narrative: If the global crypto market turns bearish, this demand zone may no longer hold. --- 📖 Pattern Interpretation (Deeper Look) Accumulation or Distribution? This yellow zone can only mean one of two things: If buyers hold → it’s a multi-year accumulation base before the next bull leg. If buyers fail → it’s a long-term distribution zone leading to deeper lows. Key: Only a confirmed weekly close can separate a real move from a fake-out. --- 🎯 Potential Strategies Conservative (Swing Traders): Enter after a confirmed breakout above 1.08. Targets 1.26–1.60. Aggressive (Accumulation Play): Buy within 0.70–0.80 demand zone with tight stop below 0.65. First target 1.08–1.26. Bearish Setup: Short after weekly close below 0.67. Targets 0.45–0.30. ⚠️ Risk management is essential: limit position risk to 1–2% of capital per trade. --- 📝 Conclusion TWT is standing at the most decisive support zone since 2021. The market will soon reveal whether this is: Bullish: a multi-year accumulation before the next expansion. Bearish: a long-term distribution phase before deeper losses. 📌 Main Key: Wait for a confirmed weekly close with volume. Until then, the yellow box remains the battlefield of accumulation vs. distribution. --- #TWT #TrustWalletToken #TWTUSDT #CryptoAnalysis #TechnicalAnalysis #PriceAction #Altcoin #SupportResistance #Accumulation #BreakoutOrBreakdown