Technical analysis by Henrybillion about Symbol PAXG on 9/11/2025

Henrybillion
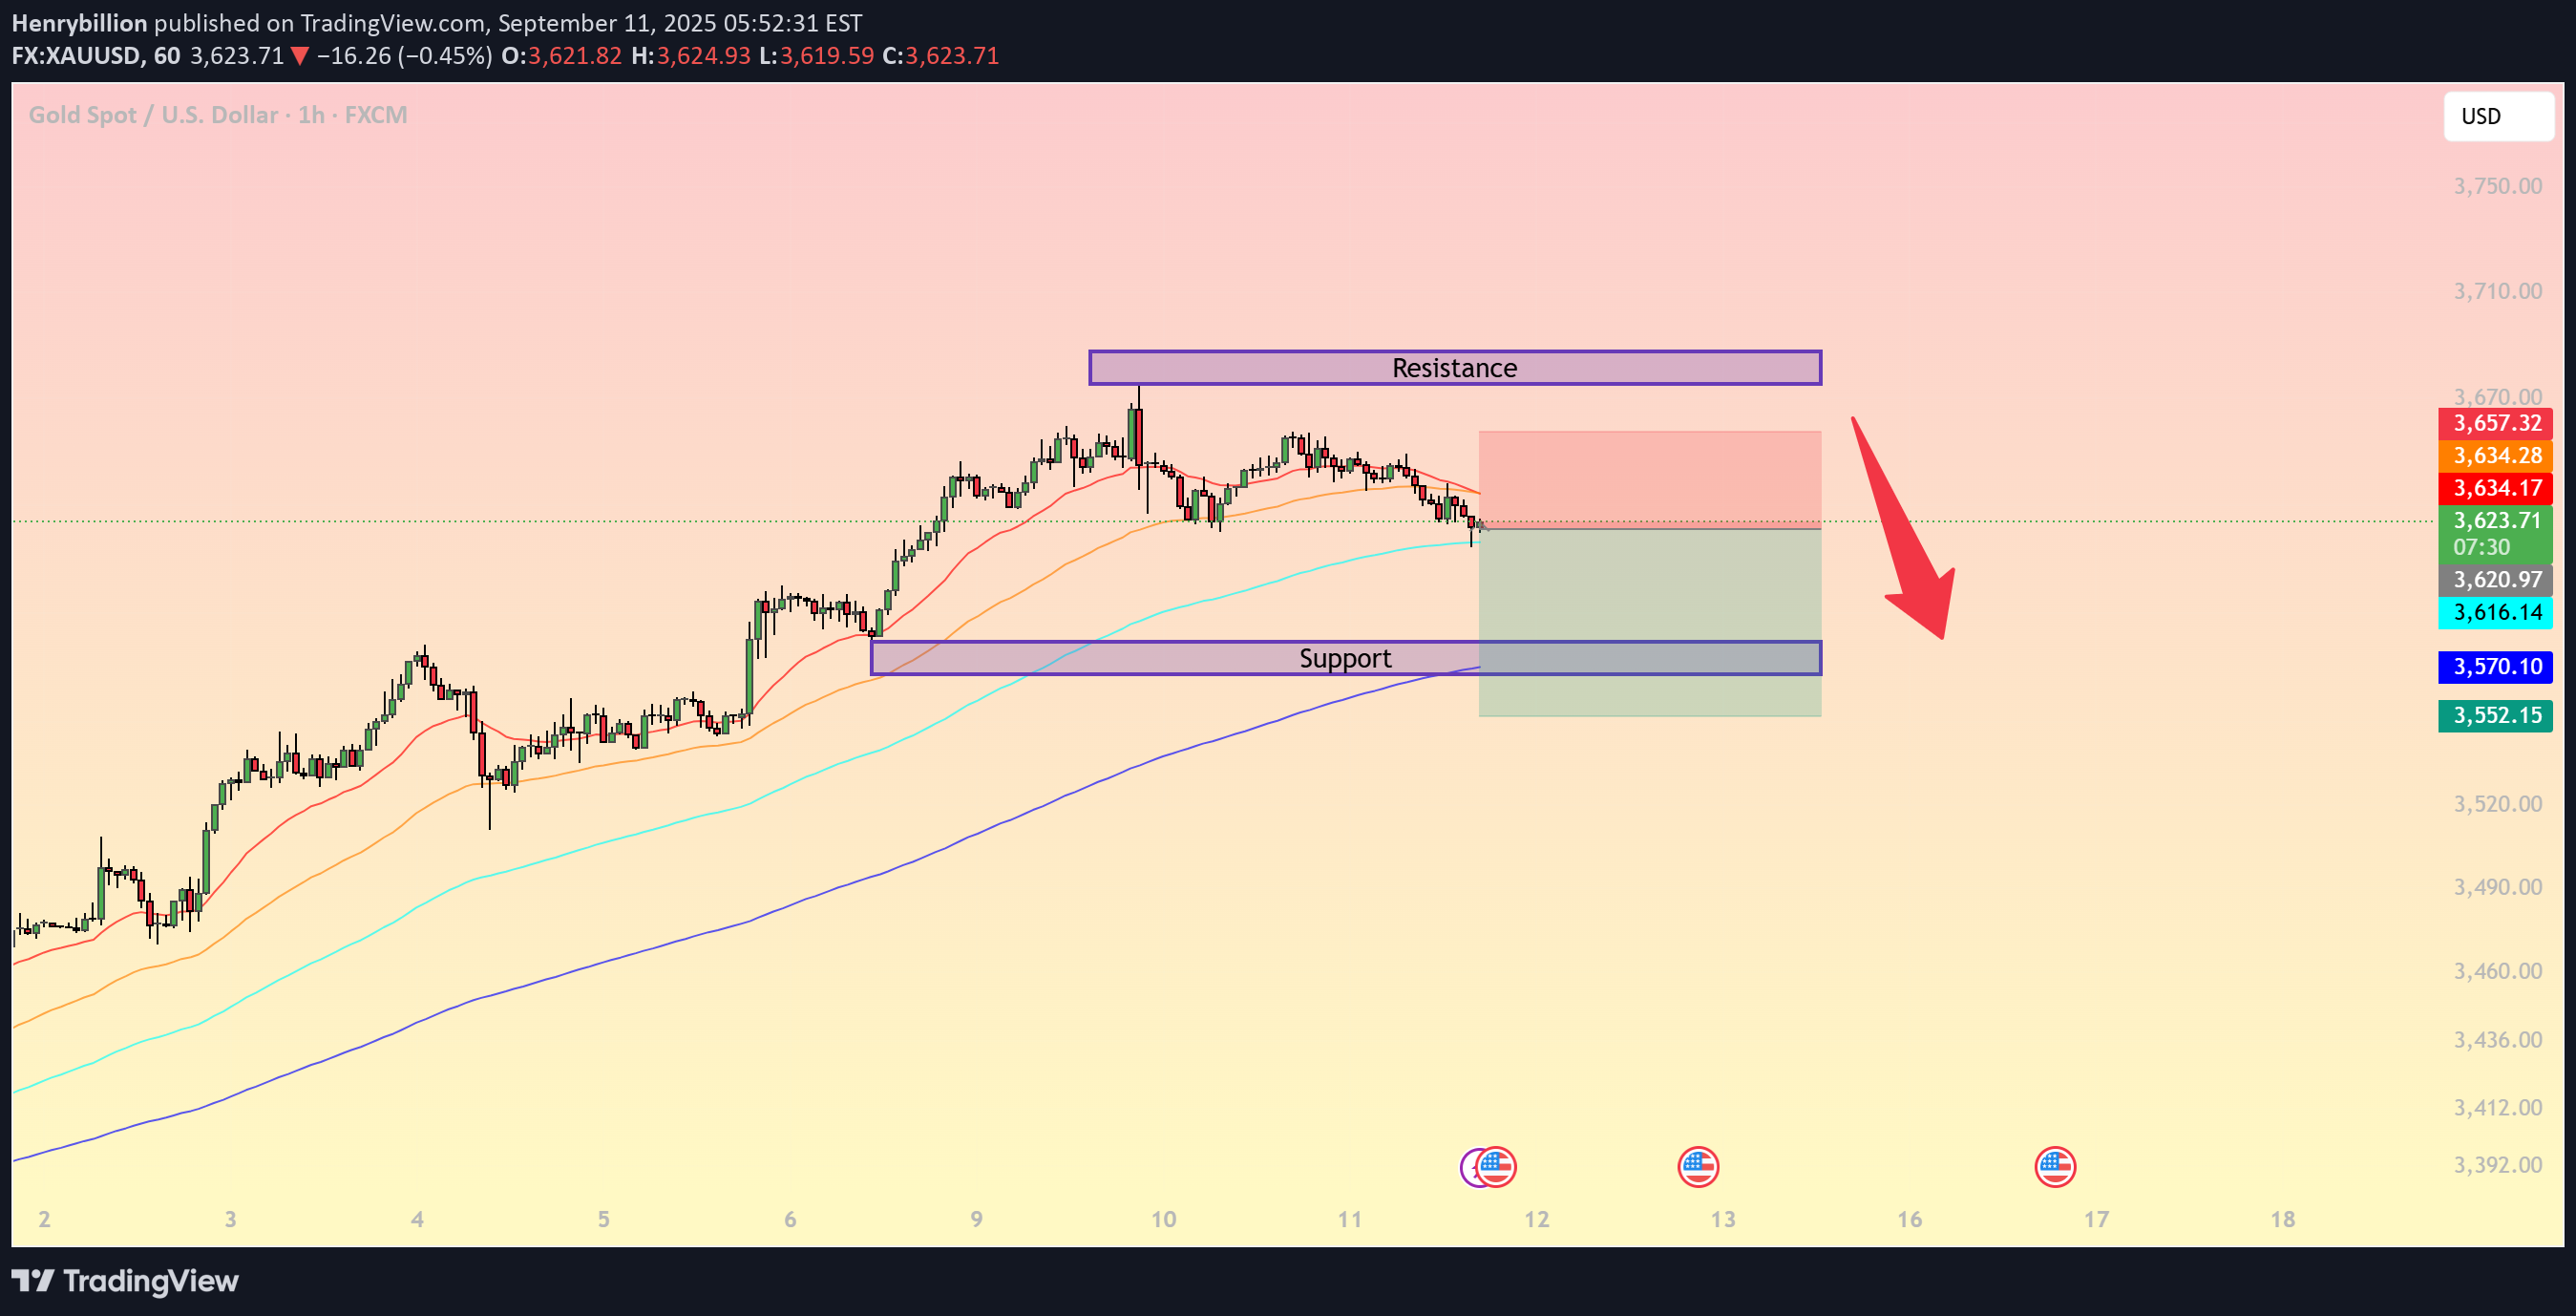
On the H1 timeframe, Gold is showing signs of weakness after failing to hold the key resistance zone. Price is currently trading around 3,622 USD, with short-term selling pressure becoming more visible. Key Technical Levels: Resistance: 3,634 – 3,657 USD → Strong supply zone where sellers are actively pushing price down. Support: 3,616 – 3,570 USD → A breakdown below this area could trigger a deeper pullback toward 3,552 USD. EMA Signals: Price has slipped below short-term EMAs and is now testing the mid-term EMA, signaling corrective momentum. The EMA200 (purple line) sits around 3,570 USD, overlapping with strong support → this level will be decisive for the next trend direction. Trading Strategy: Bearish Scenario (preferred): Consider short positions if price retests 3,630 – 3,634 USD. Targets: 3,616 → 3,570 USD. Stop-loss above 3,657 USD. Bullish Scenario (countertrend): Only consider long entries near 3,570 – 3,552 USD if clear reversal signals appear. Recovery targets: 3,616 → 3,634 USD. Conclusion: Gold faces short-term downside pressure and may test the 3,616 – 3,570 USD support zone. The reaction around EMA200 will determine whether this is just a technical correction or the start of a deeper bearish phase.
