Technical analysis by EconomicanalysAbdulRahman about Symbol PAXG on 9/11/2025

EconomicanalysAbdulRahman
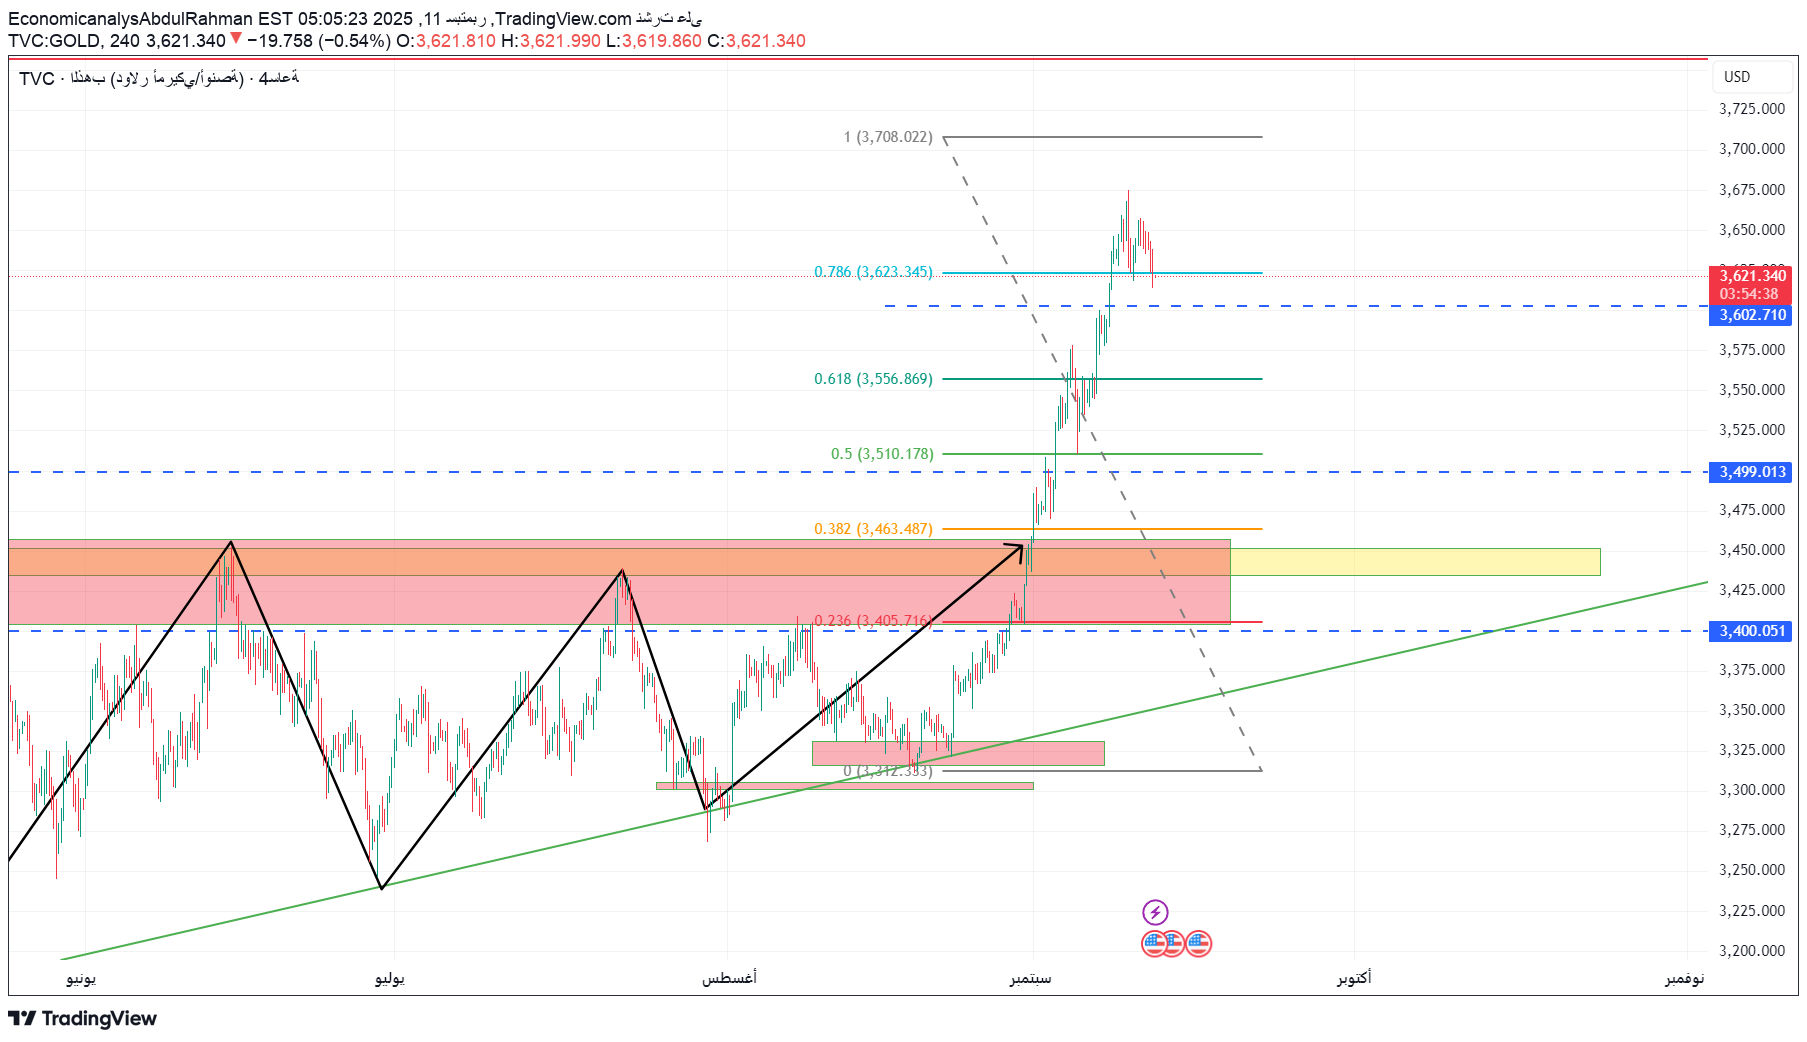
🔶 Gold analysis (xau/USD) - September 11, 2025 Time frame: 4 hours Current price: $ 3,620 per ounce Gold succeeded during the last period in penetrating a wide assembly range that spanned $ 3,350 to $ 3,450, achieving a new summit at $ 3,708 according to the Fibonacci 1.0 extension. The last movement reflected a clear purchasing power, but the fluctuation that we are currently witnessing near $ 3,620 levels reflect market waiting for US consumer price data (CPI), which is expected to come above the previous month on an annual basis. This scenario makes the market in a severe anticipation between the scenario of temporary downward correction to collect new liquidity, and the escalation scenario if the data comes less than or compatible with expectations. 🔹 The general trend: The medium -term rising after penetrating the long side range peaks. A short -term fluctuation above $ 3,600 reflects a waiting condition before the news. 🟩 Support levels - possible purchase areas The level of the importance of the level $ 3,623 - $ 3,600 initial support at Fibonacci 0.786 short -term poding level may provide a rapid bounce $ 3,556 - $ 3,560 second support at Fuo 0.618 important areas if the sales pressure continues $ 3,499 - $ 3,510 Main support at Fuo 0.5 pivotal levels maintain the upward trend $ 3,463 - 3,440 $ $ 3,400 long -term support for a rising trend, which may return the price to $ 3,181 🟥 Resistance levels - Selling areas or a possible profit profit The level of the importance of the level $ 3,660 - $ 3,680 is the first -term resistance in the short term for daily speculators $ 3,708 - $ 3,720 last summit and Fibonacci extension 1.0 strong psychological level $ 3,756 The next upward goal if penetrated $ 3,720, a potential new resistance ⏳ The expected scenario in the European period (before the data is released) With the anticipation of the higher inflation data from last month, we may witness temporary descending pressure about $ 3,600 or $ 3,560 to collect new liquidity before any major move. This area may be the opportunity to buy a speculative to stop a loss below $ 3,550 with $ 3,660 targeting - $ 3,680. 🇺🇸 The expected scenario in the American period (data time) If inflation data comes much higher than expected: The dollar is likely to be strengthened, which may push gold to correct about $ 3,510 - $ 3,463 and possibly re -test $ 3,440. If the data comes less or compatible with expectations: We may see a rapid ups from $ 3,600 or $ 3,560 to $ 3,660 and then $ 3,708 and may penetrate it to $ 3,756. 📆 Decree until the end of the week The most likely scenario: A limited descending correction to $ 3,560 - $ 3,510 (depending on the strength of the data). Then re -attempt a new climb about $ 3,708 - $ 3,756 if the investment demand continues on gold. A clear fracture of the level of $ 3,499 - $ 3,463 down will change the short -term image and put $ 3,400 - $ 3,181 as subsequent descending goals. 📝 Conclusion and the proposed strategy The general trend is still ascending, but with caution before CPI data. Daily speculative strategy: Gradually buy $ 3,600 / $ 3,560 to stop $ 3,510 and target $ 3,660 - $ 3,708. Short -range investor strategy: Promatization centers are strengthened near $ 3,510 - $ 3,463 to target $ 3,708 - $ 3,756 at the end of the week. Gradually reap profits at the aforementioned resistance areas, especially $ 3,708 and $ 3,756. This analysis is based on the current technical levels and market sensitivity of the upcoming inflation data. It is preferable to follow the price movement the moment the data is issued to confirm the strongest scenario.
