Technical analysis by SiDec about Symbol XLM: Buy recommendation (9/11/2025)

SiDec
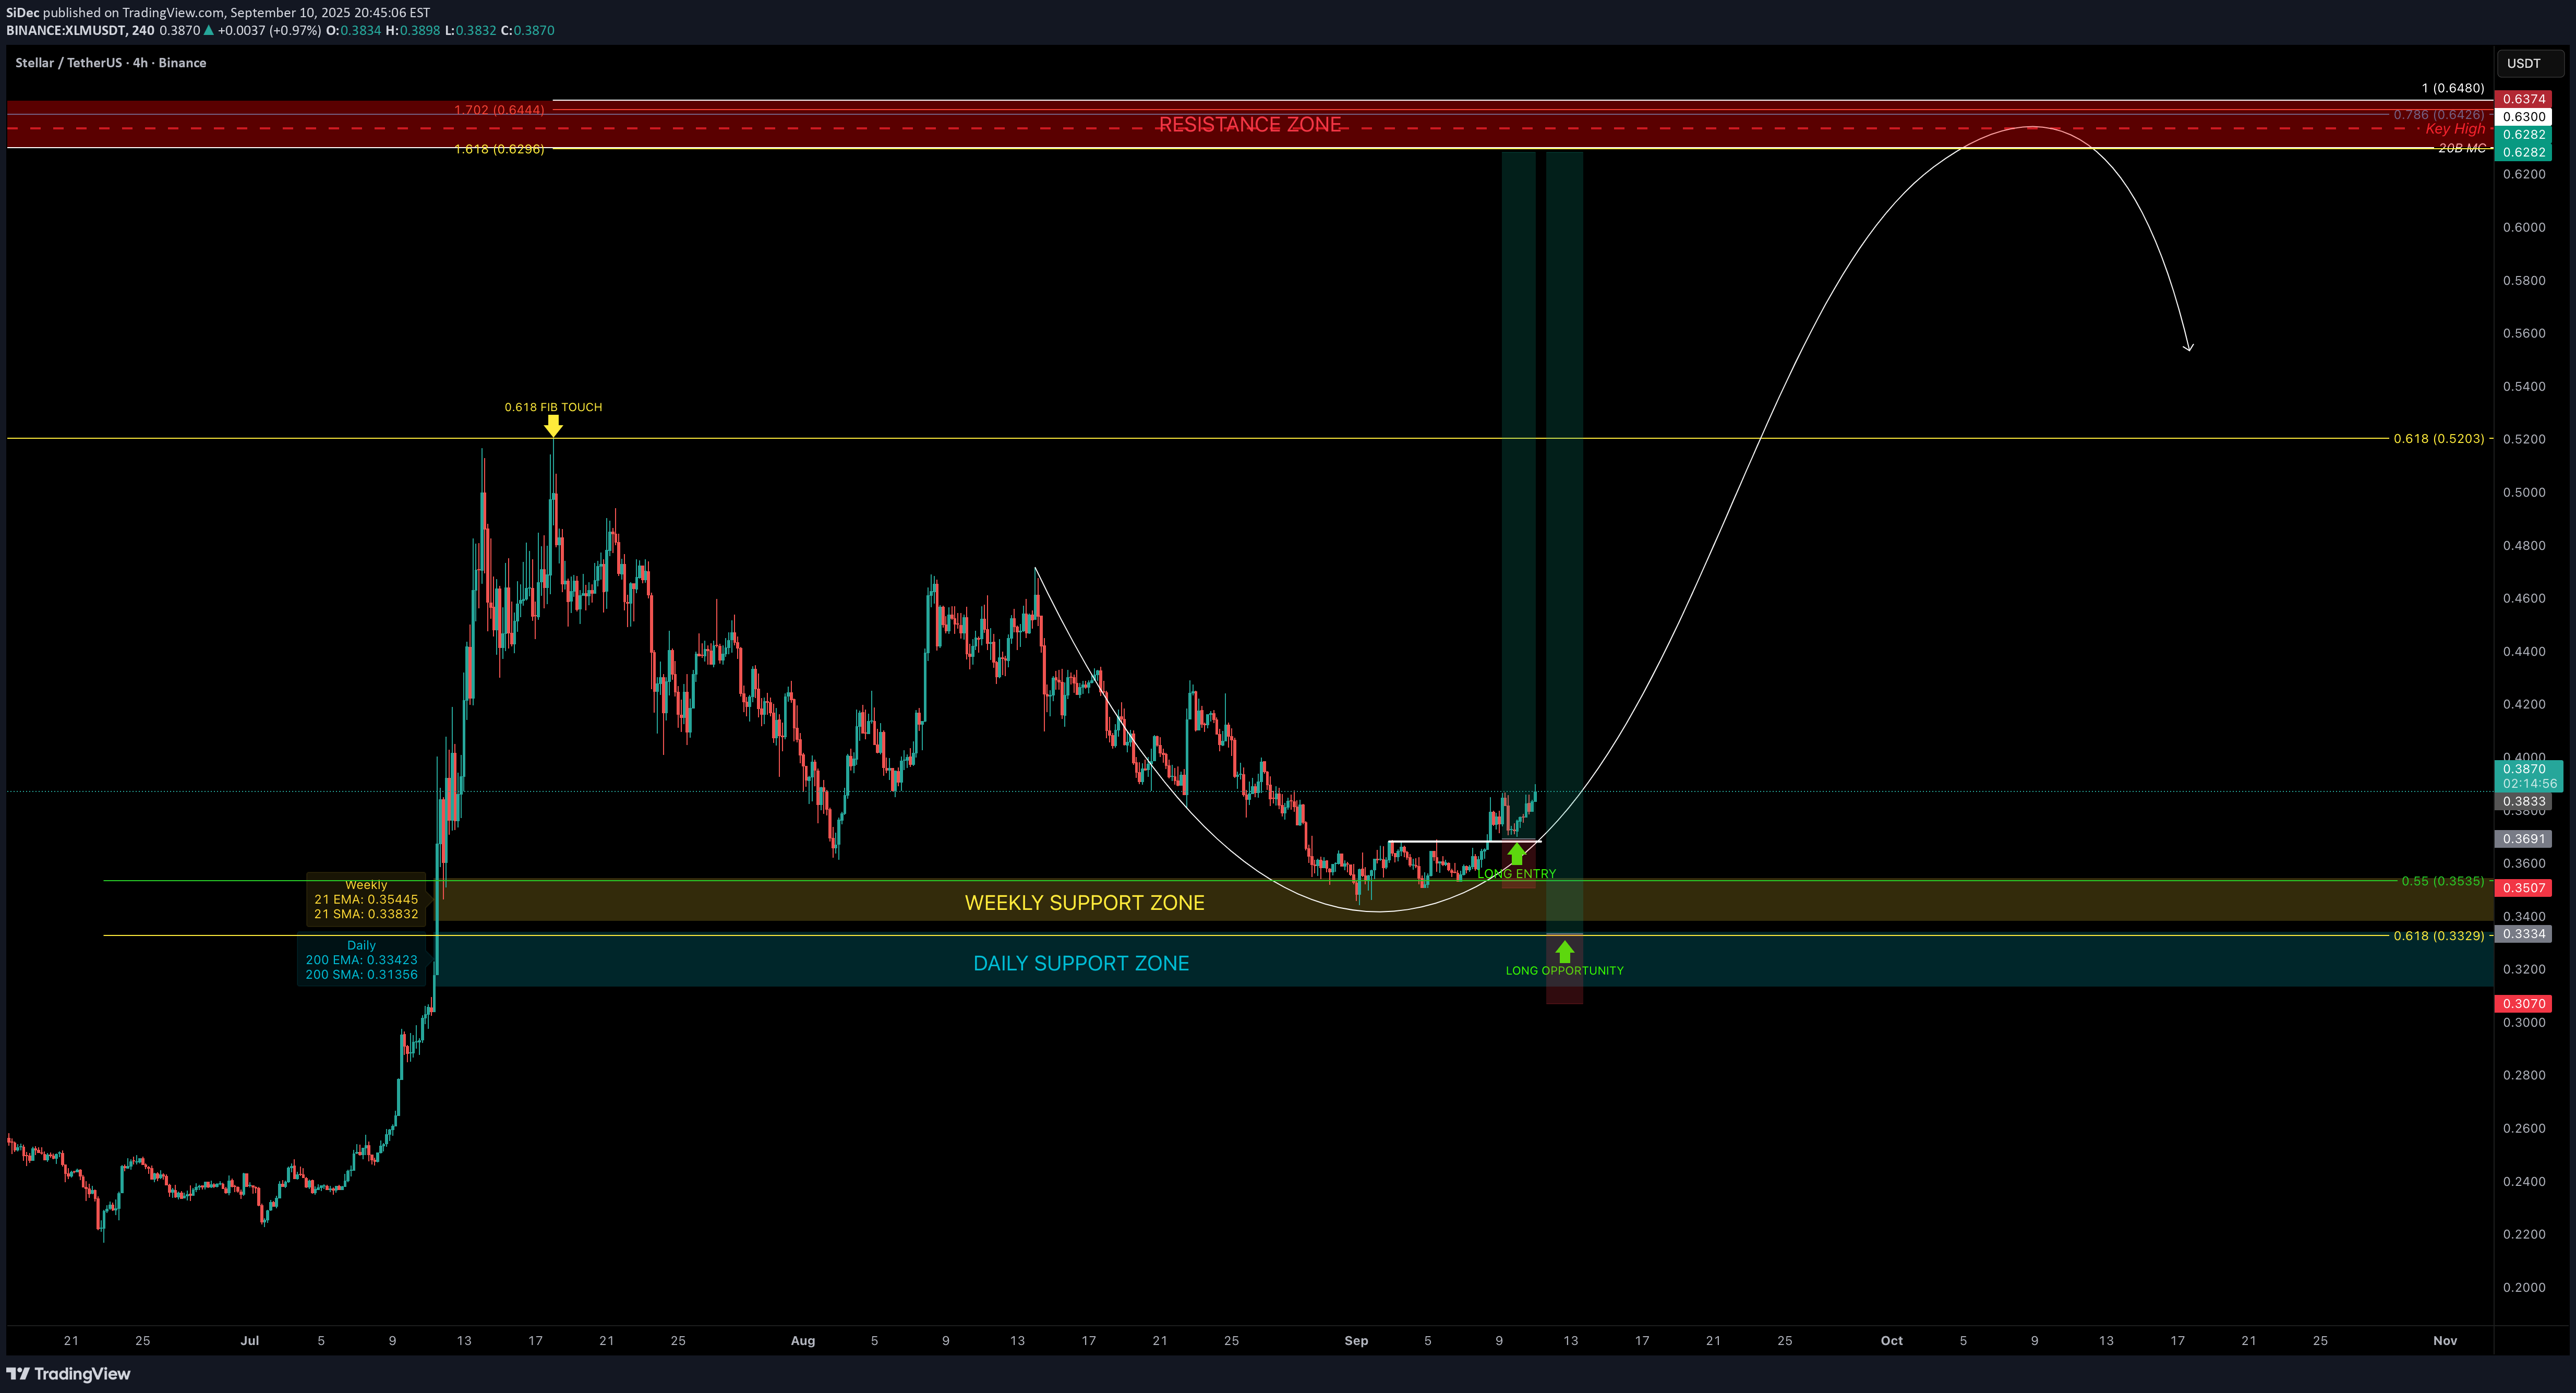
XLM recently found support at the 0.55 Fib retracement, in confluence with the 21 EMA/SMA on the weekly timeframe, triggering a bounce. The ideal 0.618 long entry unfortunately did not come into play. Support Confluence 21 EMA (weekly): $0.3536 21 SMA (weekly): $0.3384 200 EMA (daily): $0.33425 200 SMA (daily): $0.3136 This cluster around $0.35–$0.31 forms a strong dynamic support zone and a great range for DCA laddering. Resistance Confluence (Take Profit Zone $0.63–$0.65) 20B Market Cap Resistance: ~$0.63 Key High (Buy-Side Liquidity): $0.6374 0.786 Fib retracement: $0.6426 1.0 Trend-Based Fib Extension: $0.648 1.618 Fib Extension: $0.6296 Together, these create a stacked resistance cluster between $0.63–$0.65 → ideal take-profit zone and potential short setup. 🟢 Trade Plan Best Entry: Laddering (DCA) from current levels down toward $0.31 Stop-Loss: Flexible depending on DCA strategy, clear invalidation below $0.31 Target (TP Zone): $0.63–$0.65 Technical Insight The bounce from the 0.55 Fib retracement + weekly 21 EMA/SMA shows bulls defending this zone. With strong dynamic support below and a stacked resistance confluence cluster at $0.63–$0.65, XLM may be setting up for a 70%+ rally. DCA remains the best approach, as laddering down toward $0.31 allows flexible positioning. Key Levels to Watch Support: $0.35–$0.31 (EMA/SMA cluster, DCA zone) Resistance / TP: $0.63–$0.65 (Fib, extensions, market cap confluence) 🔍 Indicators used Multi Timeframe 8x MA Support Resistance Zones [SiDec] → to identify support and resistance zones such as the weekly 21 EMA/SMA. ➡️ Available for free. You can find it on my profile under “Scripts” and apply it directly to your charts for extra confluence when planning your trades. _________________________________ 💬 If you found this helpful, drop a like and comment!
